step by step Solution ans this quetionmicro economic or macrofz I ge
HEE
PRS Hig
[TH
EE IH
Hl
i] i
HE
|
Price (dollars per pound)
TA
% TINH A
SL TTEN TTA
i: TT NATIT
HHH
Je FT AAT INT
SS ATTN
ATTEN
FANG
ATTN
YA CTT
HIIRRRNRRNRR RnR nnRNNY g
Question:
step by step Solution ans this quetionmicro economic or macrofz I ge
HEE
PRS Hig
[TH
EE IH
Hl
i] i
HE
|
Price (dollars per pound)
TA
% TINH A
SL TTEN TTA
i: TT NATIT
HHH
Je FT AAT INT
SS ATTN
ATTEN
FANG
ATTN
YA CTT
HIIRRRNRRNRR RnR nnRNNY g
This is AI generated Response.
Asked by: Vikram Kumar
Created at: 2025-10-03 01:23:04
Final Answer:
RenderedRaw Text
Did you like this answer?
# Step-by-Step Solution: Market for Orange Juice (Microeconomics)
## **Micro or Macro?**
This is a **microeconomic** question because it deals with the effects of a subsidy in a specific market (orange juice), not the whole economy.
---
## **Question Summary**
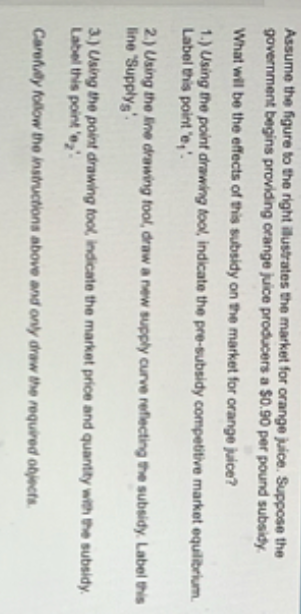
A government gives orange juice producers a $.50 per pound subsidy. You are to:
1. Indicate the pre-subsidy equilibrium.
2. Draw the new supply curve with the subsidy.
3. Indicate the new equilibrium (price & quantity).
---
## **Step 1: Pre-Subsidy Equilibrium (Point E₁)**
- **Find where the original supply and demand curves intersect.**
- This is the **competitive market equilibrium** (before subsidy).
- Label this point **E₁**.
**On the graph:**
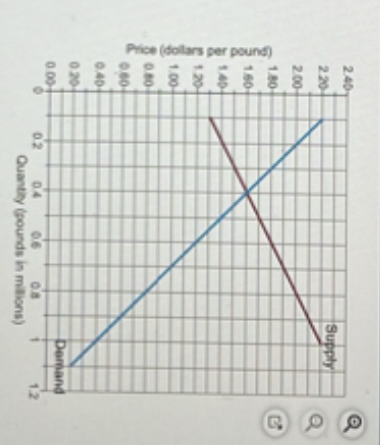
- Look for the intersection of the blue (Demand) and brown (Supply) lines.
- The corresponding price and quantity are the pre-subsidy equilibrium.
---
## **Step 2: Draw the New Supply Curve (S')**
- **A subsidy to producers shifts the supply curve down (right) by the amount of the subsidy ($.50).**
- This means for every quantity, the new supply curve is $.50 lower in price than the original.
- Draw a new supply curve parallel to the original, but $.50 lower at every point.
- Label this new curve **S'**.
---
## **Step 3: New Equilibrium (Point E₂)**
- **Find the intersection of the new supply curve (S') and the demand curve.**
- This is the **new market equilibrium** (after subsidy).
- Label this point **E₂**.
**On the graph:**
- Where S' (shifted supply) meets Demand is the new equilibrium.
- The corresponding price (paid by consumers) is lower, and quantity is higher than before.
---
## **Summary Table**
| Step | What to Do | How to Show on Graph |
|------|------------|---------------------|
| 1 | Indicate pre-subsidy equilibrium | Intersection of original Supply and Demand (label E₁) |
| 2 | Draw new supply with subsidy | Shift original Supply curve down by $.50 (label S') |
| 3 | Indicate new equilibrium | Intersection of Demand and S' (label E₂) |
---
## **Effects of the Subsidy**
- **Price for consumers falls**
- **Quantity sold increases**
- **Producers receive the market price + $.50 subsidy per pound**
---
### **Graphical Illustration Steps (Text Based)**
1. **Mark E₁**: Find where the Demand and original Supply curve cross.
2. **Draw S'**: For each quantity, plot a point $.50 lower in price than the original supply, and connect these points.
3. **Mark E₂**: Find where Demand crosses S', and mark this as E₂.
---
If you need a visual drawing or further calculation, let me know!
Question:
provide step by step answer with explaintion
This is AI generated Response.
Asked by: Vikram Kumar
Created at: 2025-10-03 01:27:38
Final Answer:
RenderedRaw Text
Did you like this answer?
# Step-by-Step Solution: Analyzing the Impact of a Subsidy on Orange Juice Market
## **Micro or Macro?**
This question pertains to **microeconomics** as it focuses on the impact of a subsidy on a specific market (orange juice), rather than the economy as a whole.
---
## **Problem Overview**
The government provides a subsidy of $0.50 per pound to orange juice producers. You will:
1. Identify the pre-subsidy equilibrium.
2. Illustrate the new supply curve with the subsidy.
3. Determine the new market equilibrium (price and quantity).
---
## **Step 1: Pre-Subsidy Equilibrium (E₁)**
- **Objective**: Locate the intersection of the original supply and demand curves.
- This intersection represents the **pre-subsidy equilibrium**.
**Instructions**:
- On the graph, find the point where the original **Demand** (D) and **Supply** (S) curves intersect.
- Label this point as **E₁**.
---
## **Step 2: Adjusting the Supply Curve (S')**
- **Objective**: Shift the supply curve downwards by the amount of the subsidy ($0.50).
- This adjustment reflects that producers can supply the same quantity at a lower price due to the subsidy.
**Instructions**:
- Draw a new supply curve, **S'**, parallel to the original supply curve (S), but positioned $0.50 lower at each quantity level.
- This shift represents the increased willingness of producers to supply orange juice at a lower price.
---
## **Step 3: New Equilibrium (E₂)**
- **Objective**: Identify the new equilibrium after the subsidy.
- This is where the new supply curve (S') intersects the demand curve.
**Instructions**:
- On the graph, find the intersection point between the **Demand** curve and the new **Supply** curve (S').
- Label this new intersection as **E₂**.
---
## **Summary of Findings**
| Step | Description | Graphical Representation |
|------|-------------|--------------------------|
| 1 | Identify pre-subsidy equilibrium | Intersection of original Supply (S) and Demand (D) at E₁ |
| 2 | Adjust supply for subsidy | Draw new Supply curve (S') shifted down by $0.50 |
| 3 | Determine new equilibrium | Intersection of Demand and new Supply (S') at E₂ |
---
## **Effects of the Subsidy**
- **Consumer Price**: The price consumers pay for orange juice decreases.
- **Quantity Sold**: The total quantity of orange juice sold in the market increases.
- **Producer Revenue**: Producers benefit from the market price plus an additional $0.50 per pound from the subsidy.
---
### **Visual Representation Steps**
1. **Mark E₁**: Identify and label the intersection of the original demand and supply curves on the graph.
2. **Draw S'**: Shift the supply curve downwards by $0.50 for each quantity and label this new curve as S'.
3. **Mark E₂**: Identify the new equilibrium by finding the intersection of the demand and the new supply curve (S') and label it as E₂.
---
If you need further clarifications or calculations, feel free to ask!
Question:
Here is a supply and demand graph illustrating the effect of a $0.50 subsidy to producers, showing the pre-subsidy and post-subsidy equilibrium points. ### Pre-Subsidy Equilibrium (E₁) The original equilibrium (E₁) is where the demand and original supply curves intersect. This intersection shows the price and quantity before any subsidy is applied. ### New Sup
ly Curve with Subsidy When a subsidy of $0.50 is given to producers, the supply curve shifts downward (rightward) by $0.50 at every quantity. This new curve, S', is parallel to the original supply curve and illustrates lower producer costs due to the subsidy. ### Post-Subsidy Equilibrium (E₂) The new equilibrium (E₂) is at the intersection of the demand curve and the shifted supply curve S'. The price paid by consumers at E₂ is lower than at E₁, and the quantity traded is higher due to the subsidy. The supplied chart visually shows these concepts: the demand curve , original supply curve . shifted supply curve . and equilibrium points E₁ and E₂. Pre- and post-subsidy prices and quantities are clearly indicated
provide summary
This is AI generated Response.
Asked by: Vikram Kumar
Created at: 2025-10-03 02:21:01
Final Answer:
RenderedRaw Text
Did you like this answer?
# Summary: Impact of a $0.50 Subsidy on the Orange Juice Market
## **Microeconomic Context**
This analysis focuses on microeconomic principles by examining the effects of a government subsidy on the specific market for orange juice.
---
## **Key Concepts**
1. **Pre-Subsidy Equilibrium (E₁)**:
- The initial intersection of the demand and original supply curves determines the price and quantity before any subsidy is provided.
2. **New Supply Curve with Subsidy (S')**:
- A subsidy of $0.50 lowers the cost for producers, shifting the supply curve downward (rightward) by the subsidy amount.
- The new supply curve (S') is parallel to the original supply curve, indicating that producers can supply the same quantity at a lower price.
3. **Post-Subsidy Equilibrium (E₂)**:
- The new equilibrium is found at the intersection of the demand curve and the shifted supply curve (S').
- The price paid by consumers decreases, and the quantity sold in the market increases due to the subsidy.
---
## **Graphical Illustration**
- **E₁**: Original equilibrium point where demand intersects the original supply curve.
- **S'**: New supply curve reflecting the $0.50 subsidy.
- **E₂**: New equilibrium point where demand intersects the shifted supply curve.
---
## **Effects of the Subsidy**
- **Consumer Benefits**: Lower prices for orange juice.
- **Increased Quantity**: Higher quantity sold in the market.
- **Producer Gains**: Producers receive a market price plus the $0.50 subsidy per pound.
This summary encapsulates the shifts in supply and equilibrium in the orange juice market resulting from the subsidy, illustrating fundamental microeconomic principles.
VIPSolutions focuses on clear, step‑by‑step explanations so you can learn quickly. Whether you need an AI‑generated walkthrough or a short hint to get unstuck, each solution is organized for fast reading and easy review later.
Search similar questions, compare approaches, and bookmark the best answers for revision. Our goal is simple: quick, reliable study help that feels natural—not noisy.
 VIPSolutions
 fz I ge
HEE
PRS Hig
[TH
EE IH
Hl
i] i
HE
|
Price (dollars per pound)
TA
% TINH A
SL TTEN TTA
i: TT NATIT
HHH
Je FT AAT INT
SS ATTN
ATTEN
FANG
ATTN
YA CTT
HIIRRRNRRNRR RnR nnRNNY g