 VIPSolutions
give answer in 2 step with explanation at the end of each step and final answer at the end:Fire Dragon Co. is a hot sauce producer and distributor operating a monopoly in Heatopis. Assume that Fire Dragon is not able price discriminate, and so it sells its hot sauce to all customers at the same price per bottle. The following graph gives the marginal cost (MC), marginal revenue (MR), ‘average total cost (ATC), and demand (D) curves that Fire Dragon faces for hot sauce in Heatopia. VAR=2 Place the black point (plus symbol) on the 0raph to indicate the profit-maximizing price and quantity for Fire Dragon. If Fire Dragon is making a profit, use the green rectangle (triangle symbols) to shade in the area representing its profit. On the other hand, if Fire Dragon is suffering a loss. use the purple rectangle (diamond symbols) to shade in the area representing its loss. I 4 1% Monopoly Outcome. 300 Sa 5 H i RNG - 0 i promt Ez 1 go = é § 1» Loss H 0 0x0 ° B © os 1 15 20 25 30 35 4 ‘QUANTITY (Thousands of botes of not sauce) Suppose Fre Dragon charge $2.75 pe bore, You classmate bel ay a because Fire Dragon 3 nap ih market power, Shu che he ne price of $3.00 per bot in der to increase ro. Compete th flowing tabi to determin whether abril care price Quantity Demanded Total Revenue Totalcost profit (tars per bottle) (cans) (ootars) ___cootlars) ___cootars) 275 Law ~ 1 ] 200 Lovo + ] doce > [ 7 I | Given th carer informatio, Jabal. coec in is assertion] 3,500.00 gon should charge $2.00 per atte Suppase that a technlageal novation decreases Fire Dragons costs faces te marginal cost (HC) and average otal cot (ATC) given an th folowing raph. Speaicay, the echnoogeal novation causes on versg fied costs, theres lowering the ATC curve and moving the mC curve. ce th Bock i (os m0) te fori 0h fo ot the ro mang orice nd uty o i: roo, ve Oren nating rf, a the rn ech re sb] shed I he wen peso 0 FA, 0 th thr tnd, Fe Diagn 6 ui 3 [SA ——————— + ors cn Ee on fu -
Question:
give answer in 2 step with explanation at the end of each step and final answer at the end: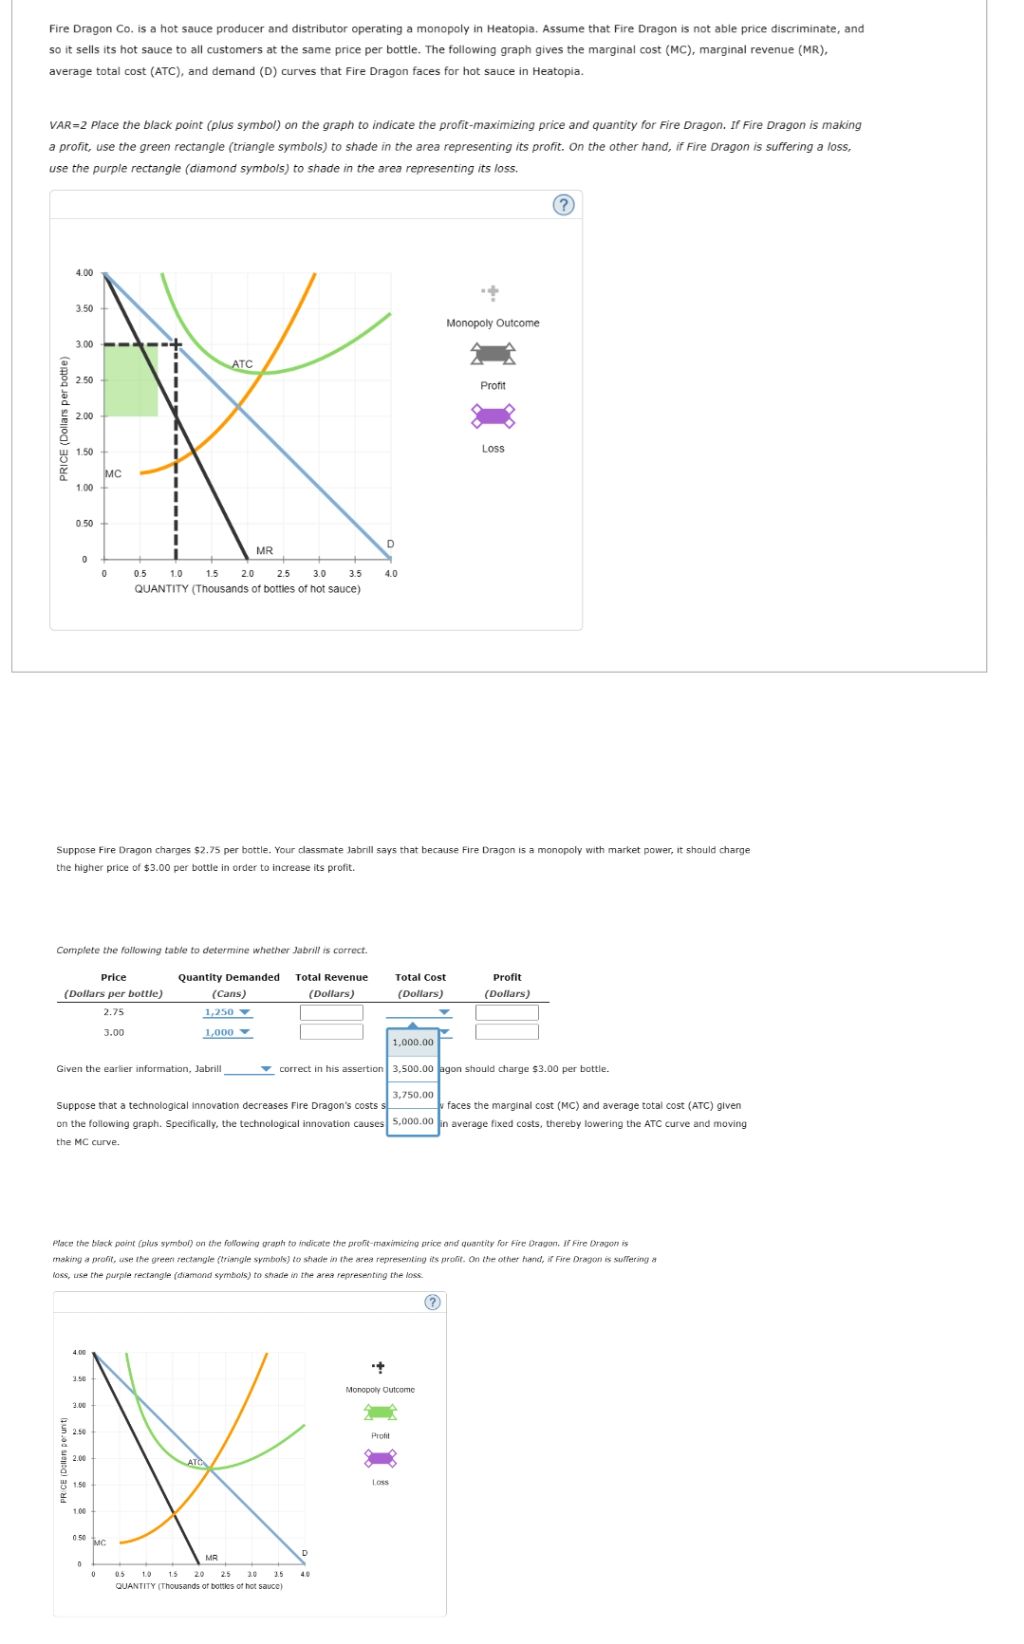 Fire Dragon Co. is a hot sauce producer and distributor operating a monopoly in Heatopis. Assume that Fire Dragon is not able price discriminate, and
so it sells its hot sauce to all customers at the same price per bottle. The following graph gives the marginal cost (MC), marginal revenue (MR),
‘average total cost (ATC), and demand (D) curves that Fire Dragon faces for hot sauce in Heatopia.
VAR=2 Place the black point (plus symbol) on the 0raph to indicate the profit-maximizing price and quantity for Fire Dragon. If Fire Dragon is making
a profit, use the green rectangle (triangle symbols) to shade in the area representing its profit. On the other hand, if Fire Dragon is suffering a loss.
use the purple rectangle (diamond symbols) to shade in the area representing its loss.
I
4
1%
Monopoly Outcome.
300 Sa
5 H
i RNG -
0 i promt
Ez 1
go =
é
§ 1» Loss
H
0
0x0
°
B
© os 1 15 20 25 30 35 4
‘QUANTITY (Thousands of botes of not sauce)
Suppose Fre Dragon charge $2.75 pe bore, You classmate bel ay a because Fire Dragon 3 nap ih market power, Shu che
he ne price of $3.00 per bot in der to increase ro.
Compete th flowing tabi to determin whether abril care
price Quantity Demanded Total Revenue Totalcost profit
(tars per bottle) (cans) (ootars) ___cootlars) ___cootars)
275 Law ~ 1 ]
200 Lovo + ]
doce > [ 7 I |
Given th carer informatio, Jabal. coec in is assertion] 3,500.00 gon should charge $2.00 per atte
Suppase that a technlageal novation decreases Fire Dragons costs faces te marginal cost (HC) and average otal cot (ATC) given
an th folowing raph. Speaicay, the echnoogeal novation causes on versg fied costs, theres lowering the ATC curve and moving
the mC curve.
ce th Bock i (os m0) te fori 0h fo ot the ro mang orice nd uty o i: roo, ve Oren
nating rf, a the rn ech re sb] shed I he wen peso 0 FA, 0 th thr tnd, Fe Diagn 6 ui 3
[SA ———————
+
ors cn
Ee on
fu -
Asked by: Rahul
Created at: 2025-12-16 10:37:48
Final Answer:
Question:
Solved all parts please
Asked by: Rahul
Created at: 2025-12-16 10:38:09
Final Answer:
📢 Instructions:
- Ask anything relatd to above question only.
- For new Question goto :