 VIPSolutions
solve with proper explanation and draw all the required diagramsA piston cylinder device that has stops on either side is initially filled with water at 300 kPa and 400°C (Fig Below). The water is allowed to cool at constant pressure until it exists as a saturated vapor and the piston rests on the stops. Then the water continues to cool until the pressure is 100 KPa. a) Draw the T-v diagram, sketch, with respect to the saturation lines, the process curves passing through the initial, intermediate, and final states of the water. Label the T, P, and v values for end states on the process curves. (8pts) b) Find the overall change in internal energy between the initial and final states per unit mass of water. (2pts) ‘Water P1=300kPa Ti=400°C
Question:
solve with proper explanation and draw all the required diagrams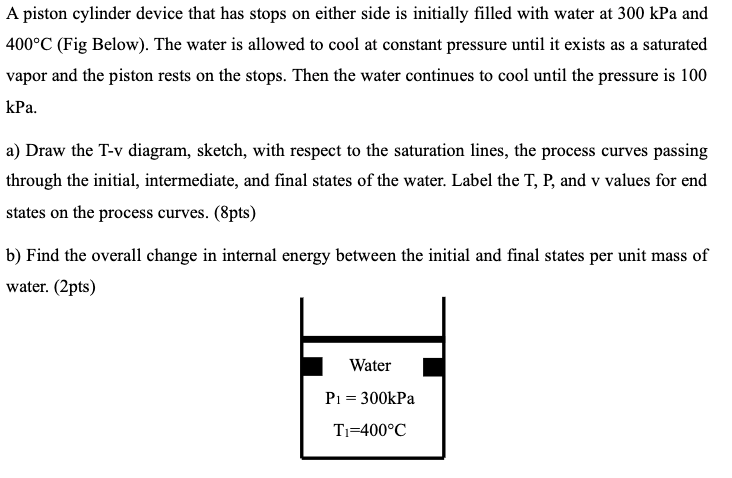 A piston cylinder device that has stops on either side is initially filled with water at 300 kPa and
400°C (Fig Below). The water is allowed to cool at constant pressure until it exists as a saturated
vapor and the piston rests on the stops. Then the water continues to cool until the pressure is 100
KPa.
a) Draw the T-v diagram, sketch, with respect to the saturation lines, the process curves passing
through the initial, intermediate, and final states of the water. Label the T, P, and v values for end
states on the process curves. (8pts)
b) Find the overall change in internal energy between the initial and final states per unit mass of
water. (2pts)
‘Water
P1=300kPa
Ti=400°C
This is AI generated Response.
Asked by: manish kumar
Created at: 2025-08-15 11:24:22
Asked by: manish kumar
Created at: 2025-08-15 11:24:22
Final Answer:
Rendered
Raw Text
Did you like this answer?
Let's break the problem down step by step:
## **Given Data**
- **Initial State (State 1):**
- Pressure (\(P_1\)) = **300 kPa**
- Temperature (\(T_1\)) = **400°C**
- **Process:**
1. **Cool at constant pressure (300 kPa)** until water is a saturated vapor (State 2).
2. **Cool at constant volume** (since piston is on stops) until pressure drops to **100 kPa** (State 3).
- **Final State (State 3):**
- Pressure (\(P_3\)) = **100 kPa**
---
### **a) T-v Diagram and Process Sketch**
#### **Step 1: Find Properties at Each State**
#### **State 1 (Initial, Superheated Vapor)**
- \(P_1 = 300~\text{kPa}\), \(T_1 = 400^\circ\text{C}\)
- From the steam tables:
| Property | Value |
|----------|-------|
| \(v_1\) (specific volume) | ≈ 0.25795 m³/kg |
| \(u_1\) (internal energy) | ≈ 2890.2 kJ/kg |
#### **State 2 (Saturated Vapor at 300 kPa)**
- At \(P_2 = 300~\text{kPa}\), saturated vapor (\(x=1\)):
- From steam tables:
- \(T_{sat,300}\) ≈ **133.6°C**
- \(v_2 = v_g@300kPa\) ≈ **0.60606 m³/kg**
- \(u_2 = u_g@300kPa\) ≈ **2546.5 kJ/kg**
#### **State 3 (Constant Volume Cooling to 100 kPa)**
- At \(v_3 = v_2 = 0.60606~\text{m}^3/\text{kg}\), \(P_3 = 100~\text{kPa}\)
- At \(P_3 = 100~\text{kPa}\):
\[
v_{f,100} = 0.001043~\text{m}^3/\text{kg}, \quad v_{g,100} = 1.694~\text{m}^3/\text{kg}
\]
Since \(v_3\) is between \(v_f\) and \(v_g\), water at state 3 is a **mixture** (quality \(x_3\)).
\[
x_3 = \frac{v_3 - v_{f,100}}{v_{g,100} - v_{f,100}}
= \frac{0.60606 - 0.001043}{1.694 - 0.001043} \approx 0.358
\]
Internal energy at state 3:
\[
u_3 = u_f + x_3 (u_g - u_f)
\]
From steam tables at 100 kPa:
- \(u_{f,100} = 419.04~\text{kJ/kg}\)
- \(u_{g,100} = 2506.5~\text{kJ/kg}\)
\[
u_3 = 419.04 + 0.358 \times (2506.5 - 419.04) \approx 419.04 + 0.358 \times 2087.46 \approx 419.04 + 747.4 = 1166.4~\text{kJ/kg}
\]
---
### **T-v Diagram Sketch**
Here's what the process looks like on a T-v diagram:
```
T
│
│ (1) Superheated vapor
│ *
│ /
│ /
│ /
│ /
│ * (2) Saturated vapor at P = 300kPa
│ |
│ | (constant v, v2 = v3)
│ |
│ *
│ (3) Mixture at 100kPa, x ≈ 0.36
│
└────────────────────────────── v
(Saturated liquid) (Saturated vapor)
Left dome line Right dome line
```
- **State 1:** Superheated region (above the dome) at \(P = 300~\text{kPa}, T = 400^\circ\text{C}\), \(v_1 = 0.25795~\text{m}^3/\text{kg}\)
- **Process 1→2:** Cool at constant pressure (horizontal leftward movement at \(P = 300~\text{kPa}\)) to saturated vapor line (\(T_{sat,300} = 133.6^\circ\text{C}\)), \(v_2 = 0.60606~\text{m}^3/\text{kg}\)
- **Process 2→3:** Cool at constant volume (\(v_3 = v_2 = 0.60606~\text{m}^3/\text{kg}\)) to \(P = 100~\text{kPa}\), mixture region.
---
### **b) Change in Internal Energy**
\[
\Delta u = u_3 - u_1 = 1166.4~\text{kJ/kg} - 2890.2~\text{kJ/kg} = -1723.8~\text{kJ/kg}
\]
**The internal energy of the water decreases by 1723.8 kJ/kg.**
---
## **Summary Table**
| State | P (kPa) | T (°C) | v (m³/kg) | u (kJ/kg) | x (quality) |
|-------|---------|--------|-----------|-----------|-------------|
| 1 | 300 | 400 | 0.25795 | 2890.2 | - |
| 2 | 300 | 133.6 | 0.60606 | 2546.5 | 1 |
| 3 | 100 | ? | 0.60606 | 1166.4 | 0.36 |
---
### **To Draw on Paper:**
1. Draw the saturation dome on a T-v diagram.
2. Mark State 1 above the right of the dome (superheated, 300 kPa, 400°C).
3. Draw a horizontal line (constant pressure) left to the saturated vapor line (State 2).
4. From State 2, draw a vertical line down (constant volume) into the mixture region at 100 kPa (State 3).
5. Label each state with T, P, v.
---
**If you want a digital T-v diagram, let me know!**
📢 Instructions:
- Ask anything relatd to above question only.
- For new Question goto :