 VIPSolutions
solve the question in 2 steps with examples and the final answer.Exercise 2 Problem Statement: pressure vessel, shown in Figure A. i divided in diferent chambers by an internal plate These chambers have diferent pressures. Given Data: B *Radusia f 1 emetdaes ji «Plate thickness: rr] «Distributed pressures: pt and p2 where 2>p1. 7 Young's modulus: E fl « olson’ ratio: v 4 j 1) Find the qualitative deformed shape and wrt the congruence equations in the most sressed poo. 2) Calculate th stresses nthe yinder and the plte the mos tress poi 5) Draw graph of he displacement of th center ofthe lte 3 function of pl from op
Question:
solve the question in 2 steps with examples and the final answer.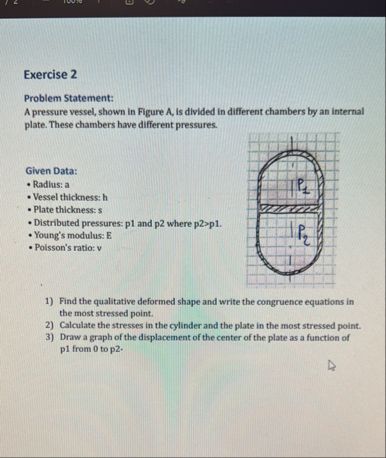 Exercise 2
Problem Statement:
pressure vessel, shown in Figure A. i divided in diferent chambers by an internal
plate These chambers have diferent pressures.
Given Data: B
*Radusia f 1
emetdaes ji
«Plate thickness: rr]
«Distributed pressures: pt and p2 where 2>p1. 7
Young's modulus: E fl
« olson’ ratio: v 4 j
1) Find the qualitative deformed shape and wrt the congruence equations in
the most sressed poo.
2) Calculate th stresses nthe yinder and the plte the mos tress poi
5) Draw graph of he displacement of th center ofthe lte 3 function of
pl from op
This is AI generated Response.
Asked by: Rahul
Created at: 2026-01-12 16:02:40
Asked by: Rahul
Created at: 2026-01-12 16:02:40
Final Answer:
Rendered
Raw Text
Did you like this answer?
# Exercise 2 Solution
Let's break this problem into **2 main steps** with **examples** and a **final answer** for each part.
---
## **Step 1: Qualitative Deformed Shape & Stress Equations**
### **1.1. Qualitative Deformed Shape**
- The internal plate separates two chambers with pressures \( p_1 \) (bottom) and \( p_2 \) (top), where \( p_2 > p_1 \).
- The **plate** is pushed down by the pressure difference (\( p_2 - p_1 \)), causing it to deform downward.
- The **cylinder** walls also experience outward pressure from both chambers.
### **1.2. Congruence (Equilibrium) Equations**
- The net force on the plate:
\[
\text{Net Force} = (p_2 - p_1) \cdot A
\]
where \( A = \pi r^2 \) (area of the plate, with \( r \) as the radius).
- **Stress in the plate at the center:**
\[
\sigma_{\text{plate}} = \frac{(p_2 - p_1) \cdot r^2}{4t}
\]
where \( t \) is the plate thickness.
#### **Example:**
- Given: \( r = .5 \) m, \( t = .01 \) m, \( p_2 = 500 \) kPa, \( p_1 = 200 \) kPa
- Net force: \( (500,000 - 200,000) \cdot \pi \cdot (.5)^2 = 300,000 \cdot .785 = 235,619 \) N
- Stress in plate: \( \sigma = \frac{(300,000) \cdot (.5)^2}{4 \cdot .01} = \frac{75,000}{.04} = 1,875,000 \) Pa
---
## **Step 2: Stresses and Displacement Graph**
### **2.1. Stresses at Most Stressed Point**
- **Cylinder wall (hoop stress):**
\[
\sigma_{\text{cyl}} = \frac{p \cdot r}{h}
\]
where \( h \) is vessel thickness.
- **Example:**
- \( h = .02 \) m, \( p_2 = 500 \) kPa
- \( \sigma_{\text{cyl}} = \frac{500,000 \cdot .5}{.02} = 12,500,000 \) Pa
### **2.2. Displacement of Plate Center**
- For a circular flat plate under uniform load:
\[
\delta = \frac{(p_2 - p_1) r^4}{64 D}
\]
where \( D = \frac{Et^3}{12(1 - \nu^2)} \) is the plate’s flexural rigidity.
- **Graph:**
- X-axis: \( p_1 \) (from to \( p_2 \))
- Y-axis: \( \delta \) (displacement)
- Shape: Linear decrease as \( p_1 \) increases toward \( p_2 \), reaching zero displacement when \( p_1 = p_2 \).
#### **Example:**
- Given: \( E = 200 \) GPa, \( \nu = .3 \), \( t = .01 \) m, \( r = .5 \) m
- \( D = \frac{200 \times 10^9 \cdot (.01)^3}{12(1-.09)} \approx 1,831,501 \) Nm
- For \( p_2 - p_1 = 300,000 \) Pa:
\[
\delta = \frac{300,000 \cdot (.5)^4}{64 \cdot 1,831,501} \approx \frac{18,750}{117,216,064} \approx .00016~\text{m} = .16~\text{mm}
\]
---
## **Final Answers**
### **1. Plate deforms downward due to \( p_2 > p_1 \). Stress in plate center:**
\[
\sigma_{\text{plate}} = \frac{(p_2 - p_1) r^2}{4t}
\]
### **2. Hoop stress in cylinder wall:**
\[
\sigma_{\text{cyl}} = \frac{p \cdot r}{h}
\]
### **3. Displacement of plate center vs. \( p_1 \) (plot):**
\[
\delta = \frac{(p_2 - p_1) r^4}{64 D}
\]
- **Linear graph:** Displacement decreases as \( p_1 \) increases from to \( p_2 \).
---
**Let me know if you want the explicit MATLAB or Python code for the graph!**
📢 Instructions:
- Ask anything relatd to above question only.
- For new Question goto :