 VIPSolutions
solve as like given answer formattingHealthCare Advantage Ltd., a multinational pharmacettical company specializing in cardiovascular and metabolic research, conducted a highly. detailed 12: week randomized clinical trial to examine whether its newly developed cholesterol-lowering drug, Cholestrix, produces a significantly greater reduction in total cholesterol levels compared to a placebo, enrolling 50 participants in the treatment group, aged between 35 5, and 65 years, who were administered a 10 mg daily, dose of Cholestrix every morning, and 55 participants in the control group, aged between 34 and 66 years, who received a visually identical placebo pill every morning, and throughout the study, all participants had their cholesterol measured at baseline, week 1, week 2, week 4, week 6, week 8, week 10, and week 12, while researchers also collected additional biometric data including body weight, height, BMI, systolic and diastolic blood pressure, resting heart rate, fasting blood 3 sugar, triglycerides, HDL and LDL cholesterol, and liver enzyme levels at each time paint, and participants were asked to maintain daily logs including total caloric intake, grams of saturated and unsaturated fat, cholesterol intake, protein, carbohydrate, fiber, weekly alcohol consumption, hours and intensity of physical activity, hours of sleep, sleep quality, medication adherence, mood, stress levels, and any minor health events such as headaches, mild fatigue, or cold symptoms, with some participants occasionally skipping doses, missing exercise sessions, consuming high-fat meals, or deviating from sleep routines, while the researchers also noted environmental factors such as temperature, humidity, and weekly activity levels outside of study requirements, although all data were included in the final analysis, and despite some outliers and minor fluctuations in cholesterol readings due to these lifestyle variations, the treatment group showed a mean = cholesterol decrease of 23.6 points with standard deviation of 48 points, and the control group showed a mean decrease of 20.1 points with a standard deviation of/5.0 points, and although some mdwsurements repeated the same mean or standard deviation values across multiple weeks, the overall goal is to determine, assuming unequal population variances, the pvalue for testing the claim that Cholestrix leads to a larger reduction in cholesterol ber the placebo, taking into account all of the aforementioned measurements, logs, side observations, environmental notes, repeated measurements, occasional skipped k doses, and Hesbie ue! 1 l 4 | [ER] ! h FL ! A HH prod gid ad i / step1 ~ Given information Compa Random variable : decrease in cholesterol level Sample 1: treatment group n,—a3 T=24 51-45 sample 2: control group my —a7 5-19 5-45 Claim py > pia ‘Assume unequal population variances. Level of significance : a = 0.05 Pyalue= 7 Explanation: Here population standard deviations are unknown and hence use t test for difference in mean. The null and alternative hypotheiss are written 25 - Hop —pa=0 Know you Hyp —pa>0 phe Compare sources from Chat The test statistics is calculated as : Plus JE ata __ ma-10 Nea Fal ~ 3.58 Degrees of freedom is calculated as: 2 (3:3) d= BNE wr tT wo a)? (E+) (EF), (#) wt Ee ~87.20 The p value is calculated as P value = Pts > 3.58) 0.00028 | from excel function | Explanations Excel function used to find area under t distribution curve fo the right of tis: — 1 T. DIST(t, df, TRUE) xc function sed excel cutout ooo0zz0arss 170sTEs0e729TRUE) es
Question:
solve as like given answer formatting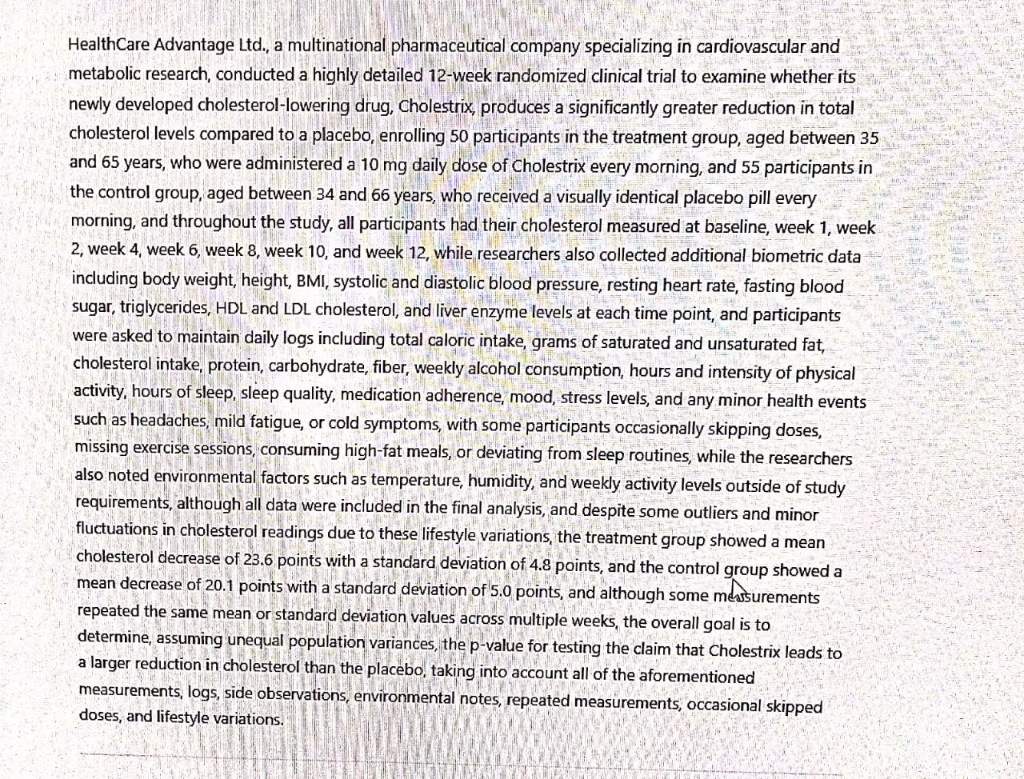
 HealthCare Advantage Ltd., a multinational pharmacettical company specializing in cardiovascular and
metabolic research, conducted a highly. detailed 12: week randomized clinical trial to examine whether its
newly developed cholesterol-lowering drug, Cholestrix, produces a significantly greater reduction in total
cholesterol levels compared to a placebo, enrolling 50 participants in the treatment group, aged between 35 5,
and 65 years, who were administered a 10 mg daily, dose of Cholestrix every morning, and 55 participants in
the control group, aged between 34 and 66 years, who received a visually identical placebo pill every
morning, and throughout the study, all participants had their cholesterol measured at baseline, week 1, week
2, week 4, week 6, week 8, week 10, and week 12, while researchers also collected additional biometric data
including body weight, height, BMI, systolic and diastolic blood pressure, resting heart rate, fasting blood 3
sugar, triglycerides, HDL and LDL cholesterol, and liver enzyme levels at each time paint, and participants
were asked to maintain daily logs including total caloric intake, grams of saturated and unsaturated fat,
cholesterol intake, protein, carbohydrate, fiber, weekly alcohol consumption, hours and intensity of physical
activity, hours of sleep, sleep quality, medication adherence, mood, stress levels, and any minor health events
such as headaches, mild fatigue, or cold symptoms, with some participants occasionally skipping doses,
missing exercise sessions, consuming high-fat meals, or deviating from sleep routines, while the researchers
also noted environmental factors such as temperature, humidity, and weekly activity levels outside of study
requirements, although all data were included in the final analysis, and despite some outliers and minor
fluctuations in cholesterol readings due to these lifestyle variations, the treatment group showed a mean =
cholesterol decrease of 23.6 points with standard deviation of 48 points, and the control group showed a
mean decrease of 20.1 points with a standard deviation of/5.0 points, and although some mdwsurements
repeated the same mean or standard deviation values across multiple weeks, the overall goal is to
determine, assuming unequal population variances, the pvalue for testing the claim that Cholestrix leads to
a larger reduction in cholesterol ber the placebo, taking into account all of the aforementioned
measurements, logs, side observations, environmental notes, repeated measurements, occasional skipped k
doses, and Hesbie ue! 1 l 4 | [ER] ! h FL !
A HH prod gid ad i /
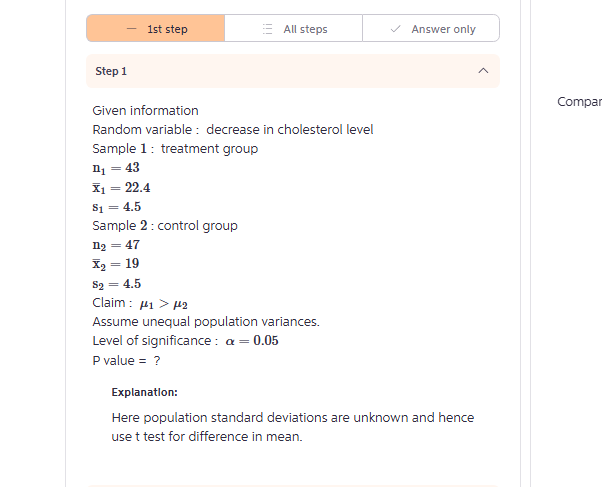
step1 ~
Given information Compa
Random variable : decrease in cholesterol level
Sample 1: treatment group
n,—a3
T=24
51-45
sample 2: control group
my —a7
5-19
5-45
Claim py > pia
‘Assume unequal population variances.
Level of significance : a = 0.05
Pyalue= 7
Explanation:
Here population standard deviations are unknown and hence
use t test for difference in mean.
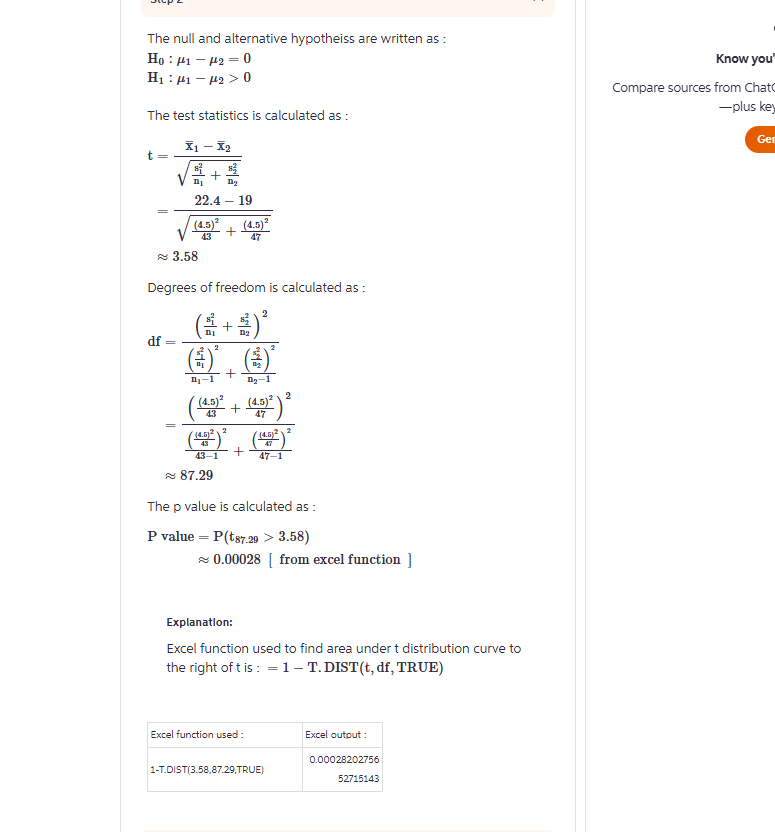
The null and alternative hypotheiss are written 25 -
Hop —pa=0 Know you
Hyp —pa>0
phe Compare sources from Chat
The test statistics is calculated as : Plus
JE
ata
__ ma-10
Nea
Fal
~ 3.58
Degrees of freedom is calculated as:
2
(3:3)
d=
BNE
wr tT
wo a)?
(E+)
(EF), (#)
wt Ee
~87.20
The p value is calculated as
P value = Pts > 3.58)
0.00028 | from excel function |
Explanations
Excel function used to find area under t distribution curve fo
the right of tis: — 1 T. DIST(t, df, TRUE)
xc function sed excel cutout
ooo0zz0arss
170sTEs0e729TRUE) es
Asked by: nayan
Created at: 2025-10-27 06:26:01
Final Answer:
📢 Instructions:
- Ask anything relatd to above question only.
- For new Question goto :