 VIPSolutions
Provide the complete solution in structural manner from start to end, i need complete detailed solution in the format of - 1st - complete solution with all the calculation, 2nd - explanation of each and every parts, 3rd final conclusion statement of all part at the end. ( Note :- don't use pronoun in the solution)3. (4 points) Identify two different tools/websites for digitally graph- ing a slope field, and fill out the table below. Tool/Website Number One: | Tool/ Website Number Two: Two Things This Tool Did Well Two Things That Would Have Improved This Tool 3
Question:
Provide the complete solution in structural manner from start to end, i need complete detailed solution in the format of - 1st - complete solution with all the calculation, 2nd - explanation of each and every parts, 3rd final conclusion statement of all part at the end. ( Note :- don't use pronoun in the solution)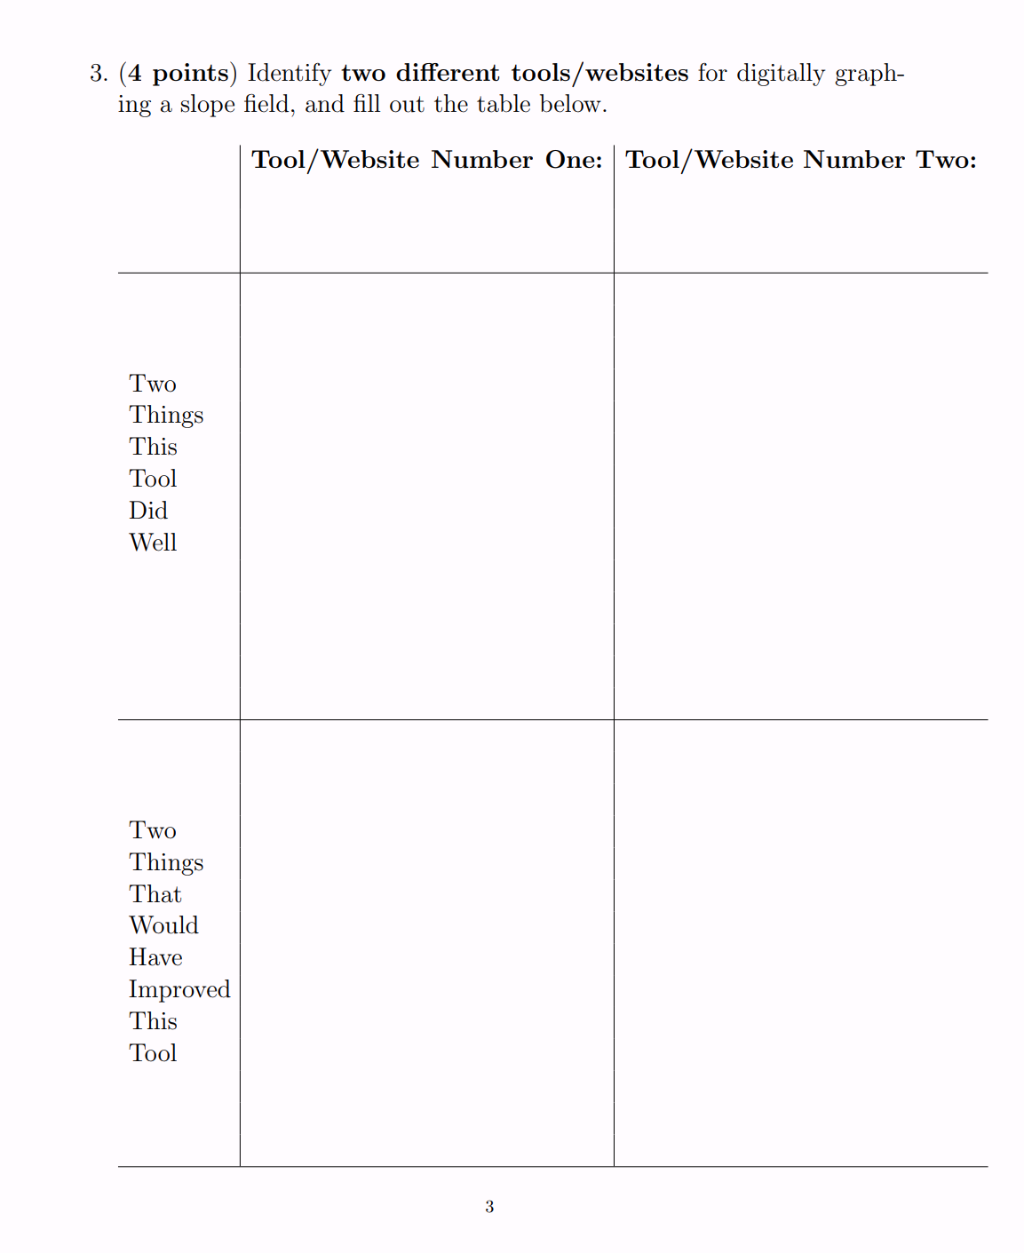 3. (4 points) Identify two different tools/websites for digitally graph-
ing a slope field, and fill out the table below.
Tool/Website Number One: | Tool/ Website Number Two:
Two
Things
This
Tool
Did
Well
Two
Things
That
Would
Have
Improved
This
Tool
3
This is AI generated Response.
Asked by: Dynamic
Created at: 2025-09-05 19:50:15
Asked by: Dynamic
Created at: 2025-09-05 19:50:15
Final Answer:
Rendered
Raw Text
Did you like this answer?
### 1st - Complete Solution with All Details
#### Tool/Website Number One: **Desmos**
- **Two Things This Tool Did Well:**
1. Provided an intuitive and user-friendly interface for inputting differential equations and graphing slope fields.
2. Allowed for real-time visualization and adjustment of parameters, making it easy to explore different slope fields quickly.
- **Two Things That Would Have Improved This Tool:**
1. Inclusion of a built-in option for exporting high-resolution images of the slope fields for reports and presentations.
2. Addition of step-by-step explanations or guides for users unfamiliar with slope fields or differential equations.
#### Tool/Website Number Two: **GeoGebra**
- **Two Things This Tool Did Well:**
1. Offered advanced customization options for grid size, line thickness, and color, enhancing the clarity of the slope field visualization.
2. Supported interactive manipulation of initial conditions and parameters, allowing for dynamic exploration of solutions.
- **Two Things That Would Have Improved This Tool:**
1. Simplification of the process for entering differential equations, as the current input method can be complex for beginners.
2. Improved loading speed and responsiveness, especially when rendering dense or complex slope fields.
---
### 2nd - Explanation of Each and Every Part
#### Tool/Website Number One: Desmos
- **What Desmos Did Well:**
- The interface is highly accessible, reducing the learning curve for new users. It supports immediate feedback when equations are entered, allowing users to see changes instantly.
- Parameter sliders and easy-to-use controls make experimentation straightforward, which is particularly helpful when learning about differential equations and slope fields.
- **Improvements for Desmos:**
- Export features are essential for incorporating graphs into documents or presentations; a higher-quality export would increase utility.
- Educational support, such as tutorials or contextual help, would assist users who may not understand the mathematical concepts behind slope fields.
#### Tool/Website Number Two: GeoGebra
- **What GeoGebra Did Well:**
- Customization options let users tailor the appearance of the slope field, which can help in distinguishing different solution curves or highlighting specific behaviors.
- The interactive nature makes it possible to explore the effects of various initial conditions, supporting deeper understanding of differential equations.
- **Improvements for GeoGebra:**
- The equation input system can be intimidating; a more guided or simplified process would make the tool more accessible.
- Performance optimizations would help ensure smooth usage, especially for users with less powerful devices or when working with detailed graphs.
---
### 3rd - Final Conclusion Statement
Both Desmos and GeoGebra are effective digital tools for graphing slope fields, excelling in user interface design, visualization capabilities, and interactive features. However, both could be improved by addressing export quality, educational support, input simplification, and performance. Selecting between these tools depends on the specific needs of the user, such as ease of use versus customization and depth of exploration. Both tools are valuable for students and educators working with differential equations and slope fields.
📢 Instructions:
- Ask anything relatd to above question only.
- For new Question goto :