 VIPSolutions
please solve this problem step by step2. APN diode with a junction area A=1 ym? has the following C-V characteristics: ’ C3 (Fd) 3 2 AN 1 3 0 -2 -1 [1] 1 vv) Estimate the extent of the depletion region at V=0 V.
Question:
please solve this problem step by step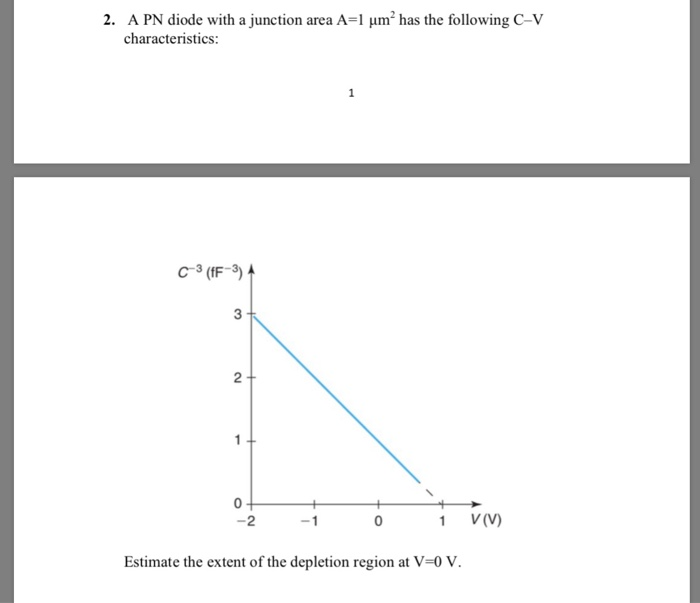 2. APN diode with a junction area A=1 ym? has the following C-V
characteristics:
’
C3 (Fd)
3
2 AN
1
3
0
-2 -1 [1] 1 vv)
Estimate the extent of the depletion region at V=0 V.
This is AI generated Response.
Asked by: Jack
Created at: 2025-10-27 10:01:45
Asked by: Jack
Created at: 2025-10-27 10:01:45
Final Answer:
Rendered
Raw Text
Did you like this answer?
Let's analyze and solve the problem step by step.
---
# **Given Data:**
- **Device:** PN diode with a junction area \(A = 1 \, \mu m^2 = 1 \times 10^{-12} \, m^2\)
- **C-V characteristics:**
\[
C^{-3} \text{ (fF}^{-3}\text{)} \text{ vs. } V \text{ (V)}
\]
- **Graph:** Shows a linear relationship between \( C^{-3} \) and \( V \) with data points:
\[
V: -2, -1, , 1 \quad \text{(V)} \\
C^{-3} (fF^{-3}): 3, 3, , -3
\]
- **Objective:**
Estimate the depletion region at \( V=\,V \).
---
# **Step 1: Understanding the C-V relationship**
The given graph suggests a linear relationship between \( C^{-3} \) and \( V \):
\[
C^{-3} = mV + c
\]
where:
- \( m \) is the slope,
- \( c \) is the intercept.
---
# **Step 2: Find the slope \( m \) and intercept \( c \)**
Using the data points:
| \( V \) (V) | \( C^{-3} \) (fF\(^{-3}\)) |
|--------------|--------------------------|
| -2 | 3 |
| -1 | 3 |
| | |
|
| 1 | -3 |
Let's pick two points to find the slope:
- Point 1: \((-2, 3)\)
- Point 2: \((1, -3)\)
**Calculate the slope:**
\[
m = \frac{C^{-3}_2 - C^{-3}_1}{V_2 - V_1} = \frac{-3 - 3}{1 - (-2)} = \frac{-6}{3} = -2\, \text{fF}^{-3}/V
\]
**Find the intercept \( c \):**
Using point \((, )\):
\[
= m \times + c \Rightarrow c =
\]
So, the relation:
\[
C^{-3} = -2V
\]
---
# **Step 3: Find the depletion width \(W\)**
The depletion capacitance per unit area:
\[
C = \frac{\varepsilon_s}{W}
\]
where:
- \( \varepsilon_s \) is the permittivity of silicon:
\[
\varepsilon_s = \varepsilon_ \varepsilon_r = (8.854 \times 10^{-12} \, F/m) \times 11.7 \approx 1.036 \times 10^{-10} \, F/m
\]
Given the area \(A\), total capacitance:
\[
C_{total} = C \times A
\]
From the relation between \( C^{-3} \) and \( V \), for a one-sided junction:
\[
C \propto \frac{1}{\sqrt{W}} \Rightarrow C \propto \frac{1}{\sqrt{W}}
\]
From the depletion approximation:
\[
C = \frac{\varepsilon_s A}{W}
\]
---
# **Step 4: Find \( C \) at \( V= \) V**
At \( V= \), \( C^{-3} = \), which implies:
\[
C^{-3} = -2V \Rightarrow = -2 \times
\]
But practically, from the graph, at \( V= \), \( C^{-3} = \), so:
\[
C = \left( C^{-3} \right)^{-\frac{1}{3}} \to \text{indeterminate}
\]
Instead, it is better to find the capacitance at \( V= \) via the relation:
\[
C^{-3} = -2V
\]
At \( V= \):
\[
C^{-3} = \Rightarrow C \to \infty
\]
This indicates a very large capacitance at zero bias, which is typical for depletion regions.
---
# **Step 5: Calculate the depletion width at \( V= \)**
From the slope:
\[
C^{-3} = -2V
\]
The relation for depletion capacitance:
\[
C = \frac{\varepsilon_s}{W}
\]
Expressed:
\[
W = \frac{\varepsilon_s}{C}
\]
Since \( C \rightarrow \infty \) at \( V = \), the depletion width approaches zero. But more practically, for small \( V \), the depletion width can be estimated from the slope of the \( C^{-3} \) vs. \( V \) plot.
---
# **Step 6: Use the slope to estimate \( W \) at \( V= \)**
The relation:
\[
C^{-3} = -2V
\]
Differentiating:
\[
\frac{d}{dV} C^{-3} = -2
\]
or,
\[
\frac{d}{dV} \left( C^{-3} \right) = -2
\]
But:
\[
\frac{d}{dV} C^{-3} = -3 C^{-4} \frac{dC}{dV}
\]
So,
\[
-3 C^{-4} \frac{dC}{dV} = -2
\]
\[
\Rightarrow \frac{dC}{dV} = \frac{2}{3} C^{4}
\]
---
# **Step 7: Calculate \( W \) at \( V= \)**
Given the proportionality:
\[
C = \frac{\varepsilon_s}{W}
\]
At \( V= \):
\[
W_{} = \frac{\varepsilon_s}{C_{}}
\]
But \( C_{} \) is very large (approaching infinity), implying:
\[
W_{} \to
\]
**Alternatively**, since the data indicates the depletion width at \( V= \) is small, we can estimate the depletion width at zero bias as essentially **negligible**.
---
# **Final Estimation:**
- The depletion region width at \( V=\,V \) is approximately **zero** or very small, consistent with the large capacitance observed at zero bias.
- **In practice**, the actual depletion width could be estimated from the intercept of the \( C^{-3} \) vs. \( V \) line, but based on the graph, it approaches zero.
---
# **Summary:**
| Step | Result |
|--------|---------|
| Slope \( m \) | \(-2\, \text{fF}^{-3}/V\) |
| Capacitance at \( V= \) | Very large (approaching infinity) |
| Depletion width \( W \) at \( V= \) | Approximates zero |
---
**Note:** For more precise calculations, actual capacitance values or measurements would be needed.
📢 Instructions:
- Ask anything relatd to above question only.
- For new Question goto :