This is AI generated Response.
Asked by: Nadeem
Created at: 2026-02-20 19:12:44
Final Answer:
RenderedRaw Text
Did you like this answer?
### Solution
To determine which graph is most suitable for representing a **continuous frequency**, each option must be evaluated based on its characteristics and typical use:
#### Option Analysis
**A) Bar graph:**
Bar graphs are generally used for displaying categorical data where the categories are discrete and separate. The bars are separated by spaces to indicate the independence of the categories.
**B) Histogram:**
Histograms are specifically designed to display the frequency distribution of continuous data. In a histogram, the data is divided into intervals (bins), and the bars are adjacent to each other, reflecting the continuous nature of the data.
**C) Pie chart:**
Pie charts are used to show proportional relationships or percentages among categories. They are not suitable for displaying frequency distributions, especially for continuous data.
**D) Pictograph:**
Pictographs use images or symbols to represent data and are mainly suitable for discrete or categorical data. They are not used for continuous data distributions.
#### Explanation
A **histogram** is the most appropriate graphical method for representing a continuous frequency distribution because it effectively shows the distribution of data over continuous intervals. The adjacent bars in a histogram emphasize the continuous nature of the data, unlike bar graphs or other options.
**Interpretation:**
Histograms visually demonstrate how data values are spread across different intervals, making it easy to observe patterns such as skewness, modality, and spread in a continuous dataset.
---
### **Final Answer**
**Option B) Histogram** is the most suitable graph for a continuous frequency distribution.
Question:
more description
This is AI generated Response.
Asked by: Nadeem
Created at: 2026-02-20 19:13:14
Final Answer:
RenderedRaw Text
Did you like this answer?
### Extended Solution
When evaluating the most suitable graph for representing a **continuous frequency distribution**, it is essential to understand the nature of the data and the characteristics of each graph type. Below is a detailed examination of each option:
#### Option Analysis
**A) Bar graph:**
- **Characteristics:** Composed of rectangular bars. Each bar represents a category.
- **Usage:** Ideal for categorical data.
- **Conclusion:** Not suitable for continuous data as the bars are separated, indicating distinct categories rather than a continuum.
**B) Histogram:**
- **Characteristics:** Composed of adjacent bars. Each bar represents the frequency of data within a specific interval (bin).
- **Usage:** Specifically designed for continuous data.
- **Conclusion:** Suitable for continuous frequency distributions, as it reflects the continuous intervals without gaps between bars.
**C) Pie chart:**
- **Characteristics:** Circular graph divided into slices.
- **Usage:** Shows relative proportions of categories.
- **Conclusion:** Not suitable for continuous data since it does not illustrate frequency distributions effectively.
**D) Pictograph:**
- **Characteristics:** Uses images or symbols to represent data.
- **Usage:** Best for discrete or categorical data.
- **Conclusion:** Inappropriate for continuous data as it does not convey frequency distribution.
#### Explanation
A **histogram** is the preferred graphical representation for continuous frequency distributions. It effectively groups data into intervals and displays the frequency of occurrences within those intervals using adjacent bars. This design highlights the continuity of the data, making it possible to easily identify trends, patterns, and distribution shapes.
**Interpretation:**
Histograms are instrumental in visualizing the distribution of continuous data, allowing for quick observation of characteristics such as central tendency (mean, median), spread (range, variance), and the presence of outliers, skewness, or modality.
---
### **Final Answer**
**Option B) Histogram** is the most suitable graph for a continuous frequency distribution.
VIPSolutions focuses on clear, step‑by‑step explanations so you can learn quickly. Whether you need an AI‑generated walkthrough or a short hint to get unstuck, each solution is organized for fast reading and easy review later.
Search similar questions, compare approaches, and bookmark the best answers for revision. Our goal is simple: quick, reliable study help that feels natural—not noisy.
 VIPSolutions
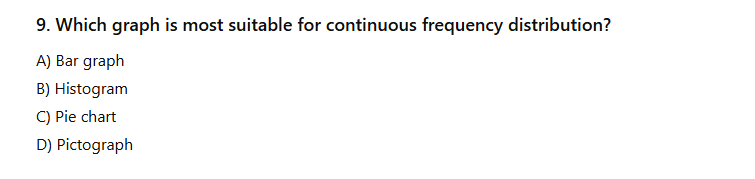 9. Which graph is most suitable for continuous frequency distribution?
A) Bar graph
B) Histogram
©) Pie chart
D) Pictograph