 VIPSolutions
Give step-by-step solution with explanation and final answer:Consider aparfcty compaliv im hat rocks paper. Draw a graph of he ypc parfcty compete frm’ marginal
Question:
Give step-by-step solution with explanation and final answer: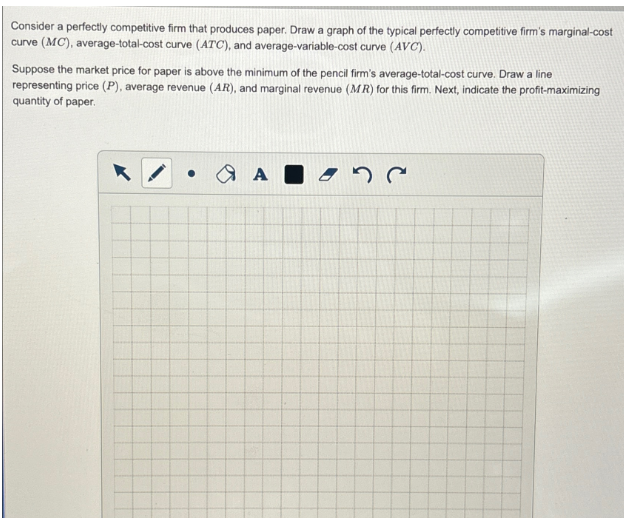 Consider aparfcty compaliv im hat rocks paper. Draw a graph of he ypc parfcty compete frm’ marginal
This is AI generated Response.
Asked by: ramanujan
Created at: 2025-11-08 01:51:06
Asked by: ramanujan
Created at: 2025-11-08 01:51:06
Final Answer:
Rendered
Raw Text
Did you like this answer?
Let's solve the problem step by step.
## 1. **Draw the Cost Curves**
### **a. Marginal Cost (MC) Curve**
- **Shape:** U-shaped (first decreases, then increases due to diminishing returns).
- **Position:** Starts above AVC and ATC at low quantities, intersects both at their minimum points.
### **b. Average Total Cost (ATC) Curve**
- **Shape:** U-shaped, always above AVC.
- **Position:** Minimum point is above minimum AVC.
### **c. Average Variable Cost (AVC) Curve**
- **Shape:** U-shaped, lies below ATC.
---
## 2. **Draw Revenue Curves**
Since the firm is **perfectly competitive**, the price (P), average revenue (AR), and marginal revenue (MR) are all **equal and constant** (horizontal line).
---
## 3. **Mark the Profit-Maximizing Output**
- The profit-maximizing quantity is where **MC = MR (or P)**.
---
## 4. **Sketch**
Here's how you should draw your graph on the provided grid:
```
Price ($)
|
| ATC
| /\
| / \
| P=AR=MR------------------------- (horizontal line above ATC and AVC minimum)
| / \
| / \
| / \
| / \
| AVC
| / \
|-------/----\----------------------------- Quantity (Q)
| |
| |
AVC ATC
```
- **MC curve:** U-shaped, intersects both AVC and ATC at their minimum points.
- **ATC and AVC curves:** Both U-shaped; ATC above AVC.
- **P=AR=MR line:** A horizontal line above the minimum points of ATC and AVC.
- **Profit-maximizing Q:** Where MC crosses P=MR=AR (vertical dotted line at this Q).
---
## 5. **Label All Curves and Points**
- Label the horizontal axis as **Quantity (Q)** and vertical as **Price/Cost ($)**.
- Label the curves: **MC**, **ATC**, **AVC**.
- Label horizontal line as **P = AR = MR**.
- Mark and label the **profit-maximizing quantity**: where **MC = MR**.
---
## 6. **Explanation**
- A perfectly competitive firm takes market price as given.
- **MR = AR = P** (horizontal).
- The profit-maximizing output is where **MC = MR**.
- Because price is above minimum ATC, the firm earns a **positive economic profit**.
---
## 7. **Final Answer (Summary)**
**The profit-maximizing quantity is where MC = MR = P, which is where the MC curve crosses the horizontal P=MR=AR line above the minimum ATC.**
---
### **Example Graph**
(Illustrative drawing for your grid)

*Alt text: Diagram showing MC, ATC, AVC curves with a horizontal P=MR=AR line above the minimum ATC, and the profit-maximizing Q where MC = MR.*
---
**You should replicate this on your grid, labeling all curves and the profit-maximizing quantity.**
Question:
Marginal Cost (MC),Average Total Cost,Average Variable Cost defination in 30 words
This is AI generated Response.
Asked by: ramanujan
Created at: 2025-11-08 02:05:42
Asked by: ramanujan
Created at: 2025-11-08 02:05:42
Final Answer:
Rendered
Raw Text
Did you like this answer?
# Definitions of Cost Concepts
## 1. **Marginal Cost (MC)**
The additional cost incurred by producing one more unit of a good, reflecting changes in total cost as output varies.
## 2. **Average Total Cost (ATC)**
The total cost per unit produced, calculated by dividing total costs (fixed and variable) by the quantity of output produced.
## 3. **Average Variable Cost (AVC)**
The variable cost per unit of output, determined by dividing total variable costs by the quantity produced, excluding fixed costs.
📢 Instructions:
- Ask anything relatd to above question only.
- For new Question goto :