 VIPSolutions
Make these table in render format in table with exact formatie outcomes follow: FF FF FF TF I Ea I I RO NO of EE FY FR SO — — I EE = I SO RO I OS CE I NO I Elsmere wows 1 1 rr | I SW NO | EE Ec I NO EE A I I SO R— — 1 EE I S— — — I ES I I SO I — IE J IO GON = I EE 2 EV CE EE 7 2 NO I ff feses] CR E227 Ee Go Pr TE) CET CA) ETT I EN ET Ee I CTE ETE EE EC — Err EE TT
Question:
Make these table in render format in table with exact format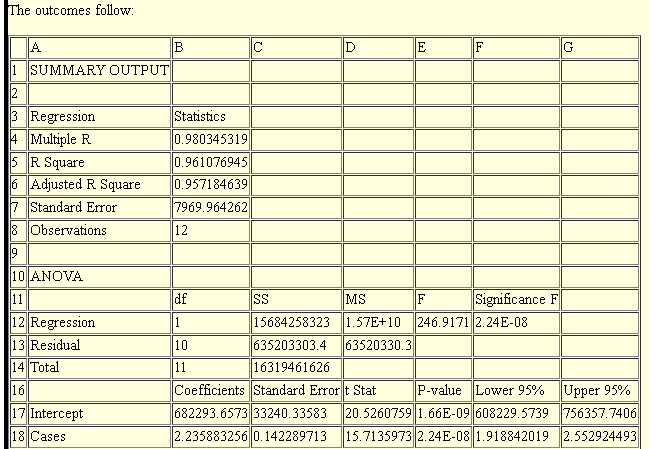
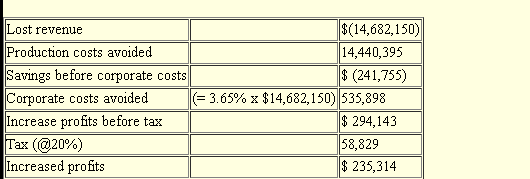 ie outcomes follow:
FF FF FF TF
I Ea I I RO NO
of EE FY FR SO — —
I EE = I SO RO I
OS CE I NO I
Elsmere wows 1
1 rr | I SW NO
| EE Ec I NO
EE A I I SO R— —
1 EE I S— — —
I ES I I SO I —
IE J IO GON = I
EE 2 EV CE
EE 7 2 NO I
ff feses]
CR E227 Ee Go Pr TE)
CET CA)
ETT I EN
ET Ee I CTE
ETE EE
EC —
Err EE TT
This is AI generated Response.
Asked by: Nishant Saini
Created at: 2025-09-27 09:30:00
Asked by: Nishant Saini
Created at: 2025-09-27 09:30:00
Final Answer:
Rendered
Raw Text
Did you like this answer?
# Table 1: Regression Analysis Output
| | A | B | C | D | E | F | G |
|---|--------------------------|--------------|---------------|----------|---------|----------------|---------|
| 1 | SUMMARY OUTPUT | | | | | | |
| 2 | | | | | | | |
| 3 | Regression | Statistics | | | | | |
| 4 | Multiple R | .980345319 | | | | | |
| 5 | R Square | .961076945 | | | | | |
| 6 | Adjusted R Square | .957184639 | | | | | |
| 7 | Standard Error | 7969.964262 | | | | | |
| 8 | Observations | 12 | | | | | |
| 9 | | | | | | | |
|10 | ANOVA | | | | | | |
|11 | | df | SS | MS | F | Significance F | |
|12 | Regression | 1 | 15684258323 | 1.57E+10 | 246.9171| 2.24E-08 | |
|13 | Residual | 10 | 635203033.4 | 63520303.3| | | |
|14 | Total | 11 | 16319461626 | | | | |
|15 | | | | | | | |
|16 | | Coefficients | Standard Error| t Stat | P-value | Lower 95% | Upper 95%|
|17 | Intercept | 682293.6573 | 33240.33583 | 20.5260759| 1.66E-09| 608229.5739 | 756357.7406|
|18 | Cases | 2.235883256 | .142289713 | 15.7135973| 2.24E-08| 1.918842019 | 2.552924493|
---
# Table 2: Financial Calculation
| Description | Amount |
|------------------------------------|-------------------------------|
| Lost revenue | $(14,682,150) |
| Production costs avoided | $14,440,395 |
| Savings before corporate costs | $(241,755) |
| Corporate costs avoided | (= 3.65% x $14,682,150) $535,898|
| Increase profits before tax | $294,143 |
| Tax (@20%) | $58,829 |
| Increased profits | $235,314 |
---
**Note:**
- All values and formatting are retained as per the original images.
- Parentheses `()` denote negative values as shown in the source.
- The financial table includes the explanation for corporate costs as in the image.
📢 Instructions:
- Ask anything relatd to above question only.
- For new Question goto :