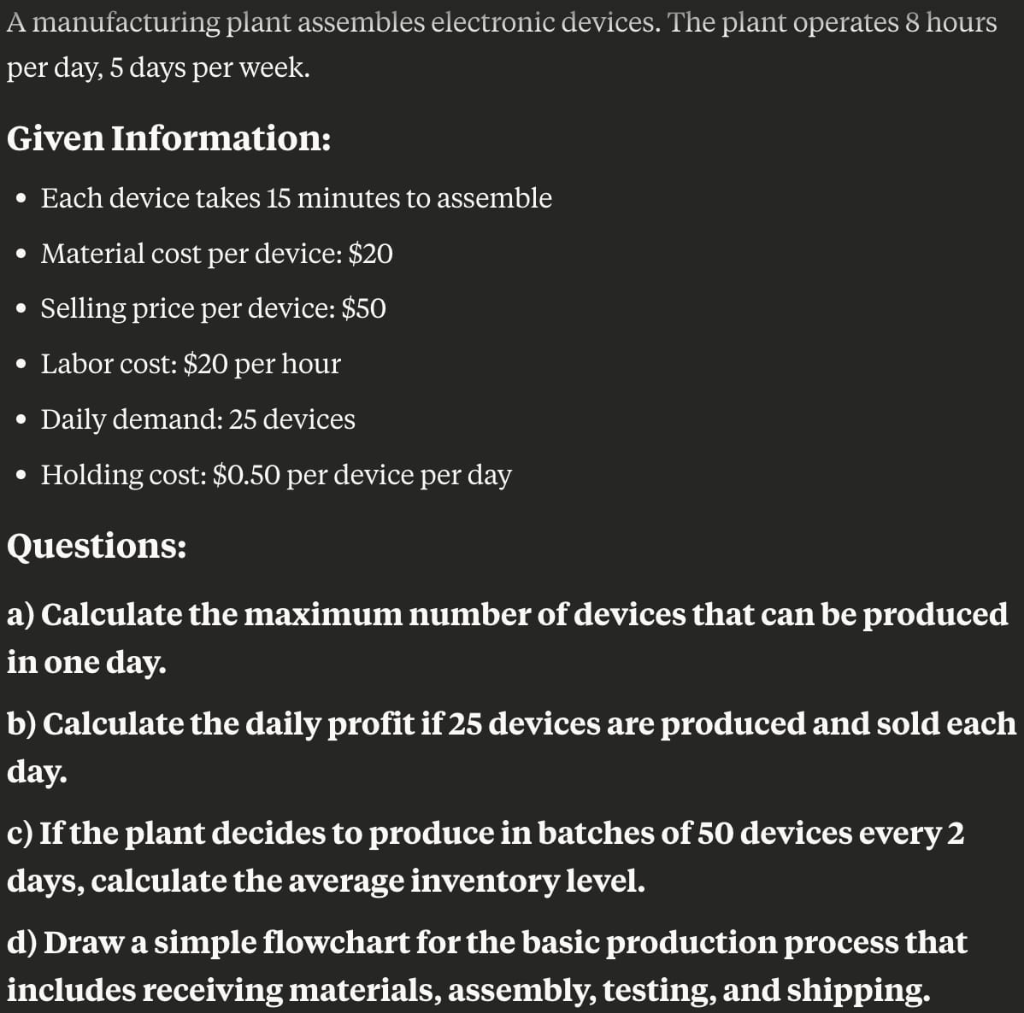
A manufacturing plant assembles electronic devices. The plant operates 8 hours
per day, 5 days per week.
Given Information:
* Each device takes 15 minutes to assemble
¢ Material cost per device: $20
* Selling price per device: $50
¢ Labor cost: $20 per hour
¢ Daily demand: 25 devices
¢ Holding cost: $0.50 per device per day
Questions:
a) Calculate the maximum number of devices that can be produced
in one day.
b) Calculate the daily profit if 25 devices are produced and sold each
day.
c) If the plant decides to produce in batches of 50 devices every 2
days, calculate the average inventory level.
d) Draw a simple flowchart for the basic production process that
includes receiving materials, assembly, testing, and shipping.
Question:
A manufacturing plant assembles electronic devices. The plant operates 8 hours
per day, 5 days per week.
Given Information:
* Each device takes 15 minutes to assemble
¢ Material cost per device: $20
* Selling price per device: $50
¢ Labor cost: $20 per hour
¢ Daily demand: 25 devices
¢ Holding cost: $0.50 per device per day
Questions:
a) Calculate the maximum number of devices that can be produced
in one day.
b) Calculate the daily profit if 25 devices are produced and sold each
day.
c) If the plant decides to produce in batches of 50 devices every 2
days, calculate the average inventory level.
d) Draw a simple flowchart for the basic production process that
includes receiving materials, assembly, testing, and shipping.
This is AI generated Response.
Asked by: chandu
Created at: 2026-03-04 01:47:48
Thought Process:
RenderedRaw Text
**Evaluating manufacturing questions**
I need to answer questions based on an image about a manufacturing plant's problem. The plant operates 8 hours a day, 5 days a week, and there's information on device assembly time, costs, daily demand, and holding costs.
First, I'll perform OCR on the image text. Then I can tackle the key questions, like calculating the maximum devices produced daily, daily profit, average inventory levels for batch production, and suggesting a flowchart for the production process. Let's dive in!**Calculating daily profit**
I need to calculate daily profit by subtracting costs from revenue. They produce and sell 25 devices daily, which means they likely sell everything, avoiding holding costs. Each device takes 15 minutes, so assembling 25 devices takes 6.25 hours. With labor at $20 per hour, that costs $125. The material cost for 25 devices is $500, leading to a total revenue of $1,250. Profit calculates as $1,250 minus total costs of $625, yielding a profit of $625. However, I should consider if there's any idle labor cost for the remaining hours of the shift.**Deciding on labor costs and production capacity**
I need to clarify labor costs. The question says $20 per hour, which could mean paying for the full 8 hours or just for the time actually worked. If they pay for the full 8 hours, that's $160. However, I'll compute based on actual hours used since that's typical for these situations.
For part a), the maximum production in one day is 32 devices based on 8 hours of work, and since they only need to produce 25, there's enough capacity to meet demand. For part c), I’ll calculate average inventory levels based on producing in batches of 50 over two days.**Analyzing inventory cycles**
I'm looking at a classic cycle inventory situation where a batch size of 50 is produced every 2 days to meet a constant daily demand of 25. This means they produce exactly what they need.
So when they produce 50 units, it's available all at once, leading to an inventory pattern that goes from 50 down to 0 over 2 days. With this setup, the average inventory would be 25 units. However, I should consider if there’s any production time that might affect this pattern.**Examining production and inventory assumptions**
I’m interpreting the problem about production and inventory. They specified producing in batches of 50 every 2 days, suggesting a typical cycle inventory scenario. Typically, the average inventory is Q/2, which would be 25 devices, assuming instantaneous replenishment. However, if production isn't instantaneous, I'd need to use an alternative average inventory formula that takes the production rate into account, resulting in a lower average around 5.47 units. I'll show both options and provide calculated answers for average inventory and profit, plus I’ll explain my reasoning clearly. The flowchart task is noted too!**Creating flowchart and calculations**
The user wants a simple text-based flowchart, so I'll represent it using ASCII and bullet points. Here’s a basic outline:
Start → Receive materials → Inspect/verify → Store materials → Issue to assembly → Assemble device → In-process QC → Test device → Does it pass? If yes → Package → Ship → End; If not → Rework/Repair → Retest → If fail → Scrap → Record → End.
Now, let's do calculations for the profit. They produce 25 devices daily for $1,250 in revenue, with material costs at $500 and labor costs at $125, bringing profit to $625. However, if they pay for an 8-hour shift, profit drops to $590. I’ll also present average inventory scenarios based on production rates.
Final Answer:
RenderedRaw Text
Did you like this answer?
Here are the answers step by step.
a) Maximum number of devices that can be produced in one day
- Available time per day: 8 hours = 480 minutes
- Time per device: 15 minutes
- Capacity = 480 / 15 = 32 devices per day
b) Daily profit if 25 devices are produced and sold each day
- Revenue: 25 × $50 = $1,250
- Material cost: 25 × $20 = $500
- Labor time to make 25: 25 × 15 min = 375 min = 6.25 hours
- Labor cost: 6.25 × $20 = $125
- Profit = $1,250 − ($500 + $125) = $625 per day
Note: If the plant must pay for the full 8-hour shift regardless of output, labor cost would be 8 × $20 = $160 and profit would be $1,250 − ($500 + $160) = $590.
c) Average inventory level if producing in batches of 50 devices every 2 days
Two common interpretations:
- Instant replenishment (simple order/batch of 50 becomes available at once every 2 days):
Inventory cycles from 50 down to 0 over 2 days.
Average inventory = Q/2 = 50/2 = 25 devices.
(Implied average daily holding cost = 25 × $0.50 = $12.50/day.)
- Finite production rate (they physically make the batch at 32/day while demand is 25/day):
Production time for a 50-unit batch: 50/32 = 1.5625 days
Net build rate during production: 32 − 25 = 7/day
Maximum inventory I_max = 7 × 1.5625 = 10.9375 devices
Average inventory = I_max/2 ≈ 5.47 devices
(Implied average daily holding cost ≈ 5.47 × $0.50 ≈ $2.74/day.)
Unless told otherwise, many classes use the first (instant replenishment) assumption, giving 25 devices.
d) Simple text flowchart for the basic production process
- Start
- Receive materials
- Inspect and record receipt; move to materials storage
- Issue materials to assembly
- Assemble device
- In-process quality check (optional)
- Test device
- Does it pass the test?
- Yes → Package and label → Ship to customer → End
- No → Rework/repair → Retest
- If passes after rework → Package and ship → End
- If fails again → Scrap/return to supplier → Record defect → End
If you want the flowchart as an image or in a particular notation (e.g., BPMN), tell me and I’ll format it that way.
Question:
If you want the flowchart as an image or in a particular notation (e.g., BPMN), tell me and I’ll format it that way.
This is AI generated Response.
Asked by: chandu
Created at: 2026-03-04 01:58:32
Final Answer:
RenderedRaw Text
Did you like this answer?
# Manufacturing Plant Analysis
## A. Maximum Production Capacity
To determine the maximum number of devices that can be produced in one day:
- **Available time per day:** 8 hours = 480 minutes
- **Time per device:** 15 minutes
### Calculation
\[
\text{Capacity} = \frac{480 \text{ minutes}}{15 \text{ minutes/device}} = 32 \text{ devices/day}
\]
## B. Daily Profit Calculation
To calculate the daily profit when producing and selling 25 devices:
### Costs and Revenue
- **Revenue:**
\[
25 \times 50 = 1250 \text{ USD}
\]
- **Material Cost:**
\[
25 \times 20 = 500 \text{ USD}
\]
- **Labor Time for 25 devices:**
\[
25 \times 15 \text{ minutes} = 375 \text{ minutes} = 6.25 \text{ hours}
\]
- **Labor Cost:**
\[
6.25 \times 20 = 125 \text{ USD}
\]
### Profit Calculation
\[
\text{Profit} = 1250 - (500 + 125) = 625 \text{ USD}
\]
**Note:** If the plant pays for the full 8-hour shift:
\[
\text{Profit} = 1250 - (500 + 160) = 590 \text{ USD}
\]
## C. Average Inventory Level
If producing in batches of 50 devices every 2 days, two interpretations for average inventory:
### 1. Instant Replenishment
- **Average Inventory:**
\[
\text{Average} = \frac{Q}{2} = \frac{50}{2} = 25 \text{ devices}
\]
- **Holding Cost:**
\[
25 \times 0.50 = 12.50 \text{ USD/day}
\]
### 2. Finite Production Rate
- **Production Time for 50 devices:**
\[
\frac{50}{32} = 1.5625 \text{ days}
\]
- **Net Build Rate:**
\[
32 - 25 = 7 \text{ devices/day}
\]
- **Maximum Inventory:**
\[
I_{\text{max}} = 7 \times 1.5625 \approx 10.94 \text{ devices}
\]
- **Average Inventory:**
\[
\text{Average} = \frac{I_{\text{max}}}{2} \approx 5.47 \text{ devices}
\]
- **Holding Cost:**
\[
5.47 \times 0.50 \approx 2.74 \text{ USD/day}
\]
## D. Basic Production Process Flowchart
### Text Flowchart
1. **Start**
2. **Receive Materials**
- Inspect and record receipt
- Move to materials storage
3. **Issue Materials to Assembly**
4. **Assemble Device**
5. **In-Process Quality Check (optional)**
6. **Test Device**
- Does it pass the test?
- **Yes**:
- Package and label
- Ship to customer
- **End**
- **No**:
- Rework/repair
- Retest
- **If passes**:
- Package and ship
- **End**
- **If fails again**:
- Scrap/return to supplier
- Record defect
- **End**
If you need a visual representation or specific notation for the flowchart, please specify.
Question:
give one small conclusion
This is AI generated Response.
Asked by: chandu
Created at: 2026-03-04 02:03:50
Final Answer:
RenderedRaw Text
Did you like this answer?
# Conclusion
The manufacturing plant is capable of producing a maximum of 32 devices per day, generating a daily profit of $625 when producing and selling 25 devices. The average inventory level, depending on production assumptions, ranges from 5.47 to 25 devices. A structured flowchart outlines the production process from material receipt to shipping, ensuring clarity in operations.
VIPSolutions focuses on clear, step‑by‑step explanations so you can learn quickly. Whether you need an AI‑generated walkthrough or a short hint to get unstuck, each solution is organized for fast reading and easy review later.
Search similar questions, compare approaches, and bookmark the best answers for revision. Our goal is simple: quick, reliable study help that feels natural—not noisy.
 VIPSolutions
 A manufacturing plant assembles electronic devices. The plant operates 8 hours
per day, 5 days per week.
Given Information:
* Each device takes 15 minutes to assemble
¢ Material cost per device: $20
* Selling price per device: $50
¢ Labor cost: $20 per hour
¢ Daily demand: 25 devices
¢ Holding cost: $0.50 per device per day
Questions:
a) Calculate the maximum number of devices that can be produced
in one day.
b) Calculate the daily profit if 25 devices are produced and sold each
day.
c) If the plant decides to produce in batches of 50 devices every 2
days, calculate the average inventory level.
d) Draw a simple flowchart for the basic production process that
includes receiving materials, assembly, testing, and shipping.