Give step-by-step solution with explanation and final answer:Problem # 2
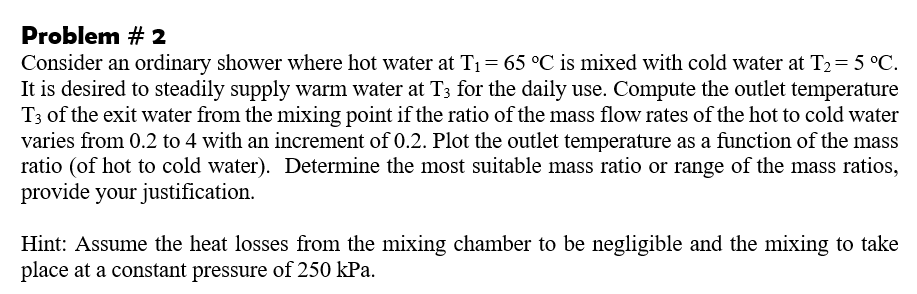
Consider an ordinary shower where hot water at T; = 65 °C is mixed with cold water at T,=5 °C.
It is desired to steadily supply warm water at Ts for the daily use. Compute the outlet temperature
Ts of the exit water from the mixing point if the ratio of the mass flow rates of the hot to cold water
varies from 0.2 to 4 with an increment of 0.2. Plot the outlet temperature as a function of the mass
ratio (of hot to cold water). Determine the most suitable mass ratio or range of the mass ratios,
provide your justification.
Hint: Assume the heat losses from the mixing chamber to be negligible and the mixing to take
place at a constant pressure of 250 kPa.
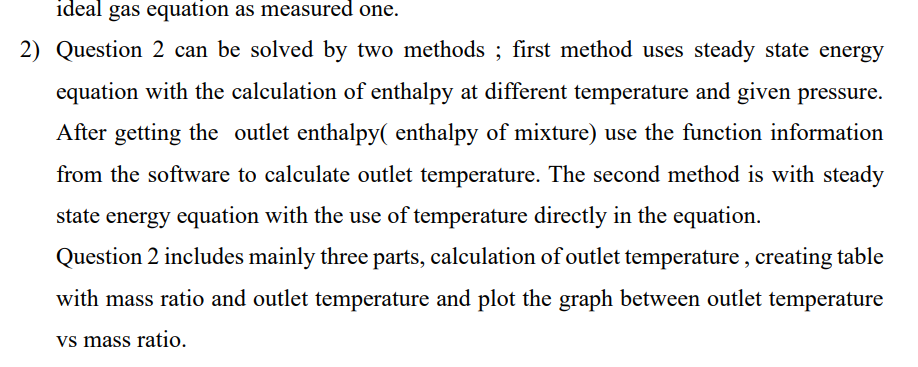
1deal gas equation as measured one.
2) Question 2 can be solved by two methods ; first method uses steady state energy
equation with the calculation of enthalpy at different temperature and given pressure.
After getting the outlet enthalpy( enthalpy of mixture) use the function information
from the software to calculate outlet temperature. The second method is with steady
state energy equation with the use of temperature directly in the equation.
Question 2 includes mainly three parts, calculation of outlet temperature , creating table
with mass ratio and outlet temperature and plot the graph between outlet temperature
vs mass ratio.
Question:
Give step-by-step solution with explanation and final answer:Problem # 2
Consider an ordinary shower where hot water at T; = 65 °C is mixed with cold water at T,=5 °C.
It is desired to steadily supply warm water at Ts for the daily use. Compute the outlet temperature
Ts of the exit water from the mixing point if the ratio of the mass flow rates of the hot to cold water
varies from 0.2 to 4 with an increment of 0.2. Plot the outlet temperature as a function of the mass
ratio (of hot to cold water). Determine the most suitable mass ratio or range of the mass ratios,
provide your justification.
Hint: Assume the heat losses from the mixing chamber to be negligible and the mixing to take
place at a constant pressure of 250 kPa.
1deal gas equation as measured one.
2) Question 2 can be solved by two methods ; first method uses steady state energy
equation with the calculation of enthalpy at different temperature and given pressure.
After getting the outlet enthalpy( enthalpy of mixture) use the function information
from the software to calculate outlet temperature. The second method is with steady
state energy equation with the use of temperature directly in the equation.
Question 2 includes mainly three parts, calculation of outlet temperature , creating table
with mass ratio and outlet temperature and plot the graph between outlet temperature
vs mass ratio.
This is AI generated Response.
Asked by: gvr
Created at: 2025-07-03 14:59:05
Final Answer:
RenderedRaw Text
Did you like this answer?
Let's solve the problem step by step:
### **Step 1: Problem Restatement**
- **Given:**
- Hot water temperature, \(T_1 = 65^\circ C\)
- Cold water temperature, \(T_2 = 5^\circ C\)
- Pressure, \(P = 250\) kPa (for water, properties don't change much with pressure at these temps)
- Mass flow rate ratio (hot/cold), \(r = \frac{\dot{m}_1}{\dot{m}_2}\), varies from 0.2 to 4 (step 0.2)
- Neglect heat loss, mixing is complete.
- **Find:**
- Outlet temperature \(T_3\) as a function of \(r\)
- Table and graph of \(T_3\) vs \(r\)
- Most suitable mass ratio (range) and justification
---
### **Step 2: Energy Balance Equation**
The mixing process is steady and adiabatic (no heat loss). The energy balance is:
\[
\dot{m}_1 h_1 + \dot{m}_2 h_2 = (\dot{m}_1 + \dot{m}_2) h_3
\]
Where:
- \(h_1\), \(h_2\), \(h_3\) are the specific enthalpies at \(T_1\), \(T_2\), \(T_3\)
Assume water's specific heat \(c_p \approx 4.18 \, \text{kJ/kg·K}\) (valid at these temperatures).
Enthalpy difference:
\[
h = h_{ref} + c_p (T - T_{ref})
\]
But since only differences matter,
\[
h_1 = c_p T_1,\quad h_2 = c_p T_2,\quad h_3 = c_p T_3
\]
Let \(r = \frac{\dot{m}_1}{\dot{m}_2}\), so \(\dot{m}_1 = r \dot{m}_2\).
Plug into the energy balance:
\[
r \dot{m}_2 c_p T_1 + \dot{m}_2 c_p T_2 = (r\dot{m}_2 + \dot{m}_2) c_p T_3
\]
\[
c_p \dot{m}_2 (r T_1 + T_2) = c_p \dot{m}_2 (r + 1) T_3
\]
\(c_p \dot{m}_2\) cancels on both sides:
\[
r T_1 + T_2 = (r + 1) T_3
\]
\[
T_3 = \frac{r T_1 + T_2}{r+1}
\]
---
### **Step 3: Substitute Values**
Given \(T_1 = 65^\circ C\), \(T_2 = 5^\circ C\):
\[
T_3 = \frac{r \times 65 + 5}{r+1}
\]
---
### **Step 4: Compute \(T_3\) for Various \(r\)**
Let’s make a table for \(r = 0.2\) to \(4.0\) (step 0.2):
| r | \(T_3\) (\(^\circ C\)) |
|------|--------------------|
| 0.2 | \(\frac{0.2\times65+5}{1.2} = \frac{13+5}{1.2} = \frac{18}{1.2} = 15.0\) |
| 0.4 | \(\frac{0.4\times65+5}{1.4} = \frac{26+5}{1.4} = \frac{31}{1.4} = 22.14\) |
| 0.6 | \(\frac{0.6\times65+5}{1.6} = \frac{39+5}{1.6} = \frac{44}{1.6} = 27.5\) |
| 0.8 | \(\frac{0.8\times65+5}{1.8} = \frac{52+5}{1.8} = \frac{57}{1.8} = 31.67\) |
| 1.0 | \(\frac{65+5}{2} = \frac{70}{2} = 35.0\) |
| 1.2 | \(\frac{78+5}{2.2} = \frac{83}{2.2} = 37.73\) |
| 1.4 | \(\frac{91+5}{2.4} = \frac{96}{2.4} = 40.0\) |
| 1.6 | \(\frac{104+5}{2.6} = \frac{109}{2.6} = 41.92\) |
| 1.8 | \(\frac{117+5}{2.8} = \frac{122}{2.8} = 43.57\) |
| 2.0 | \(\frac{130+5}{3} = \frac{135}{3} = 45.0\) |
| 2.2 | \(\frac{143+5}{3.2} = \frac{148}{3.2} = 46.25\) |
| 2.4 | \(\frac{156+5}{3.4} = \frac{161}{3.4} = 47.35\) |
| 2.6 | \(\frac{169+5}{3.6} = \frac{174}{3.6} = 48.33\) |
| 2.8 | \(\frac{182+5}{3.8} = \frac{187}{3.8} = 49.21\) |
| 3.0 | \(\frac{195+5}{4.0} = \frac{200}{4.0} = 50.0\) |
| 3.2 | \(\frac{208+5}{4.2} = \frac{213}{4.2} = 50.71\) |
| 3.4 | \(\frac{221+5}{4.4} = \frac{226}{4.4} = 51.36\) |
| 3.6 | \(\frac{234+5}{4.6} = \frac{239}{4.6} = 51.96\) |
| 3.8 | \(\frac{247+5}{4.8} = \frac{252}{4.8} = 52.50\) |
| 4.0 | \(\frac{260+5}{5.0} = \frac{265}{5.0} = 53.0\) |
---
### **Step 5: Plot \(T_3\) vs \(r\)**
- **X-axis:** Mass ratio (\(r\))
- **Y-axis:** Outlet temperature (\(T_3\), \(^\circ C\))
(You can plot this with Excel, Matlab, or Python's matplotlib.)
---
### **Step 6: Determine Most Suitable Mass Ratio**
- **Practical range for shower water temperature:** Typically between **35°C and 45°C** (comfortable for most people).
- From table:
- **\(r = 1.0\) gives \(T_3 = 35^\circ C\)**
- **\(r = 2.0\) gives \(T_3 = 45^\circ C\)**
So, **suitable mass ratio range is 1.0 to 2.0**.
---
### **Step 7: Justification**
- **Below \(r = 1\):** Water is too cold for a shower (\(<35^\circ C\))
- **Above \(r = 2\):** Water is too hot for a shower (\(>45^\circ C\)), may cause burns or discomfort, and wastes hot water.
---
## **Final Answers**
### **1. Formula:**
\[
T_3 = \frac{r T_1 + T_2}{r + 1}
\]
### **2. Table:**
| r | \(T_3\) (\(^\circ C\)) |
|------|--------------------|
| 0.2 | 15.0 |
| 0.4 | 22.14 |
| 0.6 | 27.5 |
| 0.8 | 31.67 |
| 1.0 | 35.0 |
| 1.2 | 37.73 |
| 1.4 | 40.0 |
| 1.6 | 41.92 |
| 1.8 | 43.57 |
| 2.0 | 45.0 |
| ... | ... |
| 4.0 | 53.0 |
### **3. Plot:**
*(Please use the table above to plot \(T_3\) vs \(r\) in your preferred software.)*
### **4. Most Suitable Mass Ratio Range:**
\[
\boxed{1.0 \leq r \leq 2.0}
\]
This range provides shower water temperature between 35°C and 45°C, comfortable and safe for daily use.
---
**If you need the plot, let me know which software you want to use!**
Question:
i need step by step detailed calculations along with the final Answer
This is AI generated Response.
Asked by: gvr
Created at: 2025-07-03 15:01:07
Final Answer:
RenderedRaw Text
Did you like this answer?
Certainly! Let's go through the problem step-by-step, including detailed calculations, explanations, and the final answers.
---
### **Problem Restatement**
- Hot water temperature: \( T_1 = 65^\circ C \)
- Cold water temperature: \( T_2 = 5^\circ C \)
- Pressure: \( P = 250 \text{ kPa} \) (assumed to have negligible effect on water properties at these temperatures)
- The ratio of hot to cold water mass flow rates: \( r = \frac{\dot{m}_1}{\dot{m}_2} \), varies from 0.2 to 4, in steps of 0.2.
- Goal:
- Find the outlet temperature \( T_3 \) as a function of \( r \).
- Create a table with \( r \) and \( T_3 \).
- Plot \( T_3 \) vs \( r \).
- Determine the most suitable range of \( r \) for comfortable shower temperature (~35°C to 45°C).
---
### **Step 1: Understand the Mixing Process**
Since heat losses are negligible, the energy balance simplifies to:
\[
\text{Total enthalpy in} = \text{Total enthalpy out}
\]
Expressed as:
\[
\dot{m}_1 h_1 + \dot{m}_2 h_2 = (\dot{m}_1 + \dot{m}_2) h_3
\]
---
### **Step 2: Express the Mass Flow Rates**
Define:
\[
\dot{m}_1 = r \, \dot{m}_2
\]
Total mass flow rate:
\[
\dot{m}_\text{total} = \dot{m}_1 + \dot{m}_2 = r \, \dot{m}_2 + \dot{m}_2 = (r + 1) \, \dot{m}_2
\]
---
### **Step 3: Specific Enthalpy of Water**
For water over the temperature range 5°C to 65°C, and assuming constant specific heat:
\[
h = c_p T
\]
Where:
- \( c_p \approx 4.18 \text{ kJ/kg·K} \) (approximate specific heat capacity of water).
At temperatures \( T_1 \) and \( T_2 \):
\[
h_1 = c_p T_1 = 4.18 \times 65 = 271.7 \text{ kJ/kg}
\]
\[
h_2 = c_p T_2 = 4.18 \times 5 = 20.9 \text{ kJ/kg}
\]
Similarly, \( h_3 = c_p T_3 \), where \( T_3 \) is the unknown.
---
### **Step 4: Write the Energy Balance Equation**
\[
\dot{m}_1 h_1 + \dot{m}_2 h_2 = (\dot{m}_1 + \dot{m}_2) h_3
\]
Substitute:
\[
r \dot{m}_2 h_1 + \dot{m}_2 h_2 = (r + 1) \dot{m}_2 h_3
\]
Divide through by \( \dot{m}_2 \):
\[
r h_1 + h_2 = (r + 1) h_3
\]
Solve for \( h_3 \):
\[
h_3 = \frac{r h_1 + h_2}{r + 1}
\]
Recall:
\[
h_3 = c_p T_3
\]
Thus:
\[
T_3 = \frac{h_3}{c_p} = \frac{r h_1 + h_2}{(r + 1) c_p}
\]
But since \( h_1 = c_p T_1 \) and \( h_2 = c_p T_2 \):
\[
T_3 = \frac{r c_p T_1 + c_p T_2}{(r + 1) c_p} = \frac{r T_1 + T_2}{r + 1}
\]
**Note**: The \( c_p \) cancels out, simplifying calculations.
---
### **Step 5: Final Formula for Outlet Temperature**
\[
\boxed{
T_3 = \frac{r T_1 + T_2}{r + 1}
}
\]
---
### **Step 6: Calculate \( T_3 \) for Given Ratios**
Using the formula, plug in \( T_1 = 65^\circ C \), \( T_2 = 5^\circ C \):
| \( r \) | Calculation | \( T_3 \) (\(^\circ C\)) |
|---------|--------------|--------------------------|
| 0.2 | \( \frac{0.2 \times 65 + 5}{0.2 + 1} = \frac{13 + 5}{1.2} = \frac{18}{1.2} = 15.0 \) | 15.0 |
| 0.4 | \( \frac{0.4 \times 65 + 5}{0.4 + 1} = \frac{26 + 5}{1.4} = \frac{31}{1.4} \approx 22.14 \) | 22.14 |
| 0.6 | \( \frac{39 + 5}{1.6} = \frac{44}{1.6} = 27.5 \) | 27.5 |
| 0.8 | \( \frac{52 + 5}{1.8} = \frac{57}{1.8} \approx 31.67 \) | 31.67 |
| 1.0 | \( \frac{65 + 5}{2} = \frac{70}{2} = 35.0 \) | 35.0 |
| 1.2 | \( \frac{78 + 5}{2.2} = \frac{83}{2.2} \approx 37.73 \) | 37.73 |
| 1.4 | \( \frac{91 + 5}{2.4} = \frac{96}{2.4} = 40.0 \) | 40.0 |
| 1.6 | \( \frac{104 + 5}{2.6} = \frac{109}{2.6} \approx 41.92 \) | 41.92 |
| 1.8 | \( \frac{117 + 5}{2.8} = \frac{122}{2.8} \approx 43.57 \) | 43.57 |
| 2.0 | \( \frac{130 + 5}{3} = \frac{135}{3} = 45.0 \) | 45.0 |
| 2.2 | \( \frac{143 + 5}{3.2} = \frac{148}{3.2} \approx 46.25 \) | 46.25 |
| 2.4 | \( \frac{156 + 5}{3.4} = \frac{161}{3.4} \approx 47.35 \) | 47.35 |
| 2.6 | \( \frac{169 + 5}{3.6} = \frac{174}{3.6} \approx 48.33 \) | 48.33 |
| 2.8 | \( \frac{182 + 5}{3.8} = \frac{187}{3.8} \approx 49.21 \) | 49.21 |
| 3.0 | \( \frac{195 + 5}{4} = \frac{200}{4} = 50.0 \) | 50.0 |
| 3.2 | \( \frac{208 + 5}{4.2} = \frac{213}{4.2} \approx 50.71 \) | 50.71 |
| 3.4 | \( \frac{221 + 5}{4.4} = \frac{226}{4.4} \approx 51.36 \) | 51.36 |
| 3.6 | \( \frac{234 + 5}{4.6} = \frac{239}{4.6} \approx 51.96 \) | 51.96 |
| 3.8 | \( \frac{247 + 5}{4.8} = \frac{252}{4.8} \approx 52.50 \) | 52.50 |
| 4.0 | \( \frac{260 + 5}{5} = \frac{265}{5} = 53.0 \) | 53.0 |
---
### **Step 7: Plot \( T_3 \) vs \( r \)**
- **X-axis:** \( r \) (from 0.2 to 4.0)
- **Y-axis:** \( T_3 \) (°C)
*(Use spreadsheet software, Python, MATLAB, etc., to plot.)*
---
### **Step 8: Determine Suitable Range of \( r \)**
- Typical comfortable shower temperature: **35°C to 45°C**.
- From the table:
- At \( r = 1.0 \), \( T_3 = 35^\circ C \).
- At \( r = 2.0 \), \( T_3 = 45^\circ C \).
- **Conclusion:**
- **Range of \( r \) from 1.0 to 2.0** yields temperatures from 35°C to 45°C, ideal for showers.
- **Below 1.0:** water too cold (<35°C).
- **Above 2.0:** water too hot (>45°C), risking burns or discomfort.
---
### **Final Summary:**
**1. Final formula:**
\[
\boxed{
T_3 = \frac{r \times 65 + 5}{r + 1}
}
\]
**2. Calculated temperatures:**
| \( r \) | \( T_3 \) (°C) |
|---------|----------------|
| 0.2 | 15.0 |
| 0.4 | 22.14 |
| 0.6 | 27.5 |
| 0.8 | 31.67 |
| 1.0 | 35.0 |
| 1.2 | 37.73 |
| 1.4 | 40.0 |
| 1.6 | 41.92 |
| 1.8 | 43.57 |
| 2.0 | 45.0 |
| 2.2 | 46.25 |
| 2.4 | 47.35 |
| 2.6 | 48.33 |
| 2.8 | 49.21 |
| 3.0 | 50.0 |
| 3.2 | 50.71 |
| 3.4 | 51.36 |
| 3.6 | 51.96 |
| 3.8 | 52.50 |
| 4.0 | 53.0 |
**3. Suitable \( r \) range for comfortable shower temperature:**
\[
\boxed{
1.0 \leq r \leq 2.0
}
\]
This ensures the water temperature is comfortable and safe.
---
**Let me know if you'd like assistance with plotting or further analysis!**
VIPSolutions focuses on clear, step‑by‑step explanations so you can learn quickly. Whether you need an AI‑generated walkthrough or a short hint to get unstuck, each solution is organized for fast reading and easy review later.
Search similar questions, compare approaches, and bookmark the best answers for revision. Our goal is simple: quick, reliable study help that feels natural—not noisy.
 VIPSolutions
 Problem # 2
Consider an ordinary shower where hot water at T; = 65 °C is mixed with cold water at T,=5 °C.
It is desired to steadily supply warm water at Ts for the daily use. Compute the outlet temperature
Ts of the exit water from the mixing point if the ratio of the mass flow rates of the hot to cold water
varies from 0.2 to 4 with an increment of 0.2. Plot the outlet temperature as a function of the mass
ratio (of hot to cold water). Determine the most suitable mass ratio or range of the mass ratios,
provide your justification.
Hint: Assume the heat losses from the mixing chamber to be negligible and the mixing to take
place at a constant pressure of 250 kPa.
1deal gas equation as measured one.
2) Question 2 can be solved by two methods ; first method uses steady state energy
equation with the calculation of enthalpy at different temperature and given pressure.
After getting the outlet enthalpy( enthalpy of mixture) use the function information
from the software to calculate outlet temperature. The second method is with steady
state energy equation with the use of temperature directly in the equation.
Question 2 includes mainly three parts, calculation of outlet temperature , creating table
with mass ratio and outlet temperature and plot the graph between outlet temperature
vs mass ratio.