 VIPSolutions
Give step-by-step solution with explanation and final answer:1 — Graph the followin sstam of lear necuate Ct ii HEE TE - olf Ferree : ) : f | : | | i 8 a ee — JS bounded. | p= Ti |
Question:
Give step-by-step solution with explanation and final answer: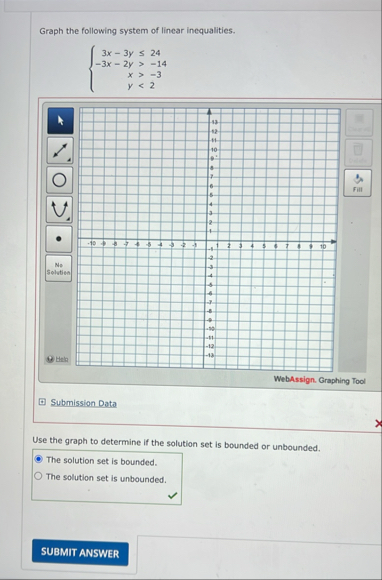 1 —
Graph the followin sstam of lear necuate
Ct
ii HEE TE -
olf Ferree
: )
: f
| : |
| i 8
a ee
—
JS bounded. |
p=
Ti |
This is AI generated Response.
Asked by: venkatesh
Created at: 2025-09-30 11:58:25
Asked by: venkatesh
Created at: 2025-09-30 11:58:25
Final Answer:
Rendered
Raw Text
Did you like this answer?
Let's solve the system of linear inequalities step by step and determine if its solution set is **bounded** or **unbounded**.
### **Given Inequalities**
1. \( 3x - 3y \leq 24 \)
2. \( -3x - 2y \leq -14 \)
3. \( x > -3 \)
4. \( y < 2 \)
---
## **Step 1: Simplify the Inequalities**
### 1. \( 3x - 3y \leq 24 \)
Divide both sides by 3:
\[
x - y \leq 8 \implies y \geq x - 8
\]
### 2. \( -3x - 2y \leq -14 \)
Multiply both sides by -1 (reverse the inequality):
\[
3x + 2y \geq 14 \implies 2y \geq 14 - 3x \implies y \geq 7 - \frac{3}{2}x
\]
### 3. \( x > -3 \)
No change needed.
### 4. \( y < 2 \)
No change needed.
---
## **Step 2: Graph Each Inequality**
1. \( y \geq x - 8 \) — Region **above** the line \( y = x - 8 \).
2. \( y \geq 7 - \frac{3}{2}x \) — Region **above** the line \( y = 7 - \frac{3}{2}x \).
3. \( x > -3 \) — Region **to the right** of the vertical line \( x = -3 \).
4. \( y < 2 \) — Region **below** the horizontal line \( y = 2 \).
---
## **Step 3: Analyze the Feasible Region**
- The region is above both \( y = x - 8 \) and \( y = 7 - \frac{3}{2}x \).
- The region is to the right of \( x = -3 \).
- The region is below \( y = 2 \).
### **Intersection and Boundary**
Let's check if the region is **bounded** or **unbounded**:
- The lines \( y \geq x - 8 \) and \( y \geq 7 - \frac{3}{2}x \) open **upwards** (since \( y \geq \)), and \( x > -3 \) is just a vertical boundary.
- However, \( y < 2 \) puts a cap at the top.
- The region is **bounded below** by the intersection of the two lines, on the left by the vertical line, and **above** by \( y = 2 \).
### **But**:
Both \( y \geq x - 8 \) and \( y \geq 7 - \frac{3}{2}x \) are **unbounded upwards** unless restricted by \( y < 2 \), which is present here.
The intersection of all these half-planes forms a **bounded quadrilateral region**. There is an upper limit (\( y < 2 \)), a lower limit (where the two lines intersect), and a left boundary (\( x > -3 \)). So, **the region is bounded**.
---
## **Step 4: Final Answer**
- **The solution set is bounded.**
---
## **Summary Table**
| Inequality | Region (in terms of y) | Region Description |
|----------------------------|------------------------------------|-----------------------------------|
| \( x - y \leq 8 \) | \( y \geq x - 8 \) | Above \( y = x - 8 \) |
| \( -3x - 2y \leq -14 \) | \( y \geq 7 - \frac{3}{2}x \) | Above \( y = 7 - \frac{3}{2}x \) |
| \( x > -3 \) | | Right of \( x = -3 \) |
| \( y < 2 \) | | Below \( y = 2 \) |
---
### **Final Answer**
> **The solution set is bounded.**
If you need the graph or further explanation on intersection points, let me know!
Question:
i need graph
This is AI generated Response.
Asked by: venkatesh
Created at: 2025-09-30 11:59:52
Asked by: venkatesh
Created at: 2025-09-30 11:59:52
Final Answer:
Rendered
Raw Text
Did you like this answer?
## Graph of the System of Inequalities
To visualize the solution set for the given inequalities, we can sketch the lines and shade the appropriate regions.
### **Inequalities to Graph**
1. **Line for** \( y = x - 8 \)
- Slope: 1
- Y-intercept: -8
2. **Line for** \( y = 7 - \frac{3}{2}x \)
- Slope: -1.5
- Y-intercept: 7
3. **Vertical line** at \( x = -3 \)
4. **Horizontal line** at \( y = 2 \)
### **Steps to Create the Graph**
1. **Draw the lines**:
- For \( y = x - 8 \), plot points like (-8, -8) and (8, 0) and connect them.
- For \( y = 7 - \frac{3}{2}x \), plot points like (0, 7) and (4, -1) and connect them.
- Draw a dashed vertical line at \( x = -3 \) (since \( x > -3 \)).
- Draw a dashed horizontal line at \( y = 2 \) (since \( y < 2 \)).
2. **Shade the regions**:
- Shade **above** the line \( y = x - 8 \).
- Shade **above** the line \( y = 7 - \frac{3}{2}x \).
- Shade **to the right** of the line \( x = -3 \).
- Shade **below** the line \( y = 2 \).
### **Intersection Points**
To find the intersection points of the two lines, set them equal to each other:
\[
x - 8 = 7 - \frac{3}{2}x
\]
### **Solving for Intersection Points**
1. Rearranging gives:
\[
x + \frac{3}{2}x = 15
\]
\[
\frac{5}{2}x = 15 \implies x = 6
\]
2. Substitute \( x = 6 \) back into either equation to find \( y \):
\[
y = 6 - 8 = -2
\]
### **Final Graph Illustration**
- The bounded region will be formed between the lines and the horizontal and vertical boundaries.
Here is a sketch of the graph based on the inequalities:
```plaintext
|
2|---------------------- (y = 2)
|
|
|
|
-+---------------------------- (x = -3)
-8| * (6, -2)
|
|
-3|---------------------- (y = x - 8)
|
|
|
|
|
-14|------------------- (y = 7 - (3/2)x)
|
```
### **Conclusion**
- The shaded area represents the feasible region, confirming that the solution set is indeed bounded.
If you need a more accurate graphical representation, consider using graphing software to plot these inequalities.
📢 Instructions:
- Ask anything relatd to above question only.
- For new Question goto :