 VIPSolutions
Give step-by-step solution with explanation and final answer:‘The amount of monthly data usage by a sample of 10 cellphone users (in GB) is shown below. 31,2968,58,12,32,1076,73,53,55,28 Identity potential imegularities in the data Identity potential imegularities. Select all that apply. A. The sixth value B. The third value C. The seventh value D. The second value E. The tenth value F. The fourth value G. The eighth value H. The ninth value I The firstvalue J. The fifth value
Question:
Give step-by-step solution with explanation and final answer: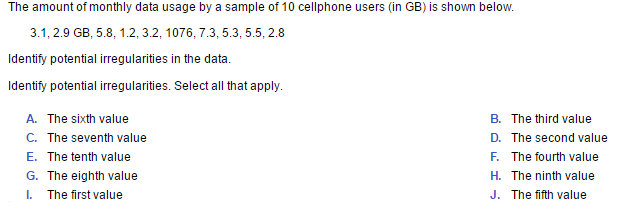 ‘The amount of monthly data usage by a sample of 10 cellphone users (in GB) is shown below.
31,2968,58,12,32,1076,73,53,55,28
Identity potential imegularities in the data
Identity potential imegularities. Select all that apply.
A. The sixth value B. The third value
C. The seventh value D. The second value
E. The tenth value F. The fourth value
G. The eighth value H. The ninth value
I The firstvalue J. The fifth value
This is AI generated Response.
Asked by: gvr
Created at: 2025-06-25 08:00:00
Asked by: gvr
Created at: 2025-06-25 08:00:00
Final Answer:
Rendered
Raw Text
Did you like this answer?
Let's **analyze the data** for irregularities (potential outliers):
### Data:
3.1, 2.9, 5.8, 1.2, 3.2, **1076**, 7.3, 5.3, 5.5, 2.8
### Step 1: **Look for values that are very different from the rest**
Most values are between 1.2 and 7.3.
But **1076** stands out as much larger than all others.
### Step 2: **Check each value to see if it's an outlier**
Let's list each value:
1. 3.1
2. 2.9
3. 5.8
4. 1.2
5. 3.2
6. **1076** ⟵ **Very irregular**
7. 7.3
8. 5.3
9. 5.5
10. 2.8
### Step 3: **Identify Irregularities**
- The **sixth value (1076)** is much higher than the rest (all between 1.2 and 7.3).
- The other values are within a small range (1.2–7.3), so none of them is a significant outlier.
### **Final Answer:**
#### **Potential irregularity (outlier) is:**
- **A. The sixth value**
#### **Explanation:**
- The sixth value (1076) is drastically different from the rest of the data (all other values are below 10), indicating it may be a data entry error or a true but extreme outlier.
---
**Select:**
- **A. The sixth value**
Question:
i need detailed explanation of each option along with the final Answer
This is AI generated Response.
Asked by: gvr
Created at: 2025-06-25 08:01:43
Asked by: gvr
Created at: 2025-06-25 08:01:43
Final Answer:
Rendered
Raw Text
Did you like this answer?
Let's analyze each option carefully to determine which data points are potential irregularities or outliers in the dataset.
---
### **Given Data:**
Values (in GB):
1. 3.1
2. 2.9
3. 5.8
4. 1.2
5. 3.2
6. 1076
7. 7.3
8. 5.3
9. 5.5
10. 2.8
---
### **Step 1: Understanding what irregularities mean**
- Outliers are data points that significantly differ from other observations.
- They can be unusually high or low compared to the rest of the data.
- Identifying outliers helps understand whether they are errors or genuine extreme values.
---
### **Step 2: Examine each data point**
Let's analyze each value in context:
| Position | Value | Observation | Potential irregularity? |
|------------|---------|--------------------------------------------------------------|-----------------------------------------------------------|
| 1 | 3.1 | Within typical range (around 1–8 GB) | No |
| 2 | 2.9 | Similar to above | No |
| 3 | 5.8 | Slightly higher but still within the general range | No |
| 4 | 1.2 | Lower but still within a plausible range | No |
| 5 | 3.2 | Similar to values around 3 GB | No |
| 6 | **1076** | Extremely high compared to others | **Yes, potential outlier** |
| 7 | 7.3 | Higher end but still close to the upper limit of typical data | No |
| 8 | 5.3 | Within the usual range | No |
| 9 | 5.5 | Same as above | No |
| 10 | 2.8 | Within the normal range | No |
---
### **Step 3: Consider the options**
Now, let's evaluate each option based on the above analysis:
---
### **Option A: The sixth value**
- **Value:** 1076
- **Analysis:** This value is vastly larger than all others, which are below 10 GB.
- **Conclusion:** This is a clear outlier; very likely a data entry error or an extreme case.
**Verdict:** **Potential irregularity.**
**→ Correct choice.**
---
### **Option B: The third value**
- **Value:** 5.8
- **Analysis:** Slightly higher than some other values but still within the typical range of 1.2 to 7.3 GB.
- **Conclusion:** No, it does not stand out as irregular.
**Verdict:** No.
---
### **Option C: The seventh value**
- **Value:** 7.3
- **Analysis:** This is the highest in the dataset but still within the upper range of typical values.
- **Conclusion:** Not necessarily irregular; it can be considered a high but legitimate value.
**Verdict:** No.
---
### **Option D: The second value**
- **Value:** 2.9
- **Analysis:** Close to the other low to moderate values.
- **Conclusion:** No irregularity.
**Verdict:** No.
---
### **Option E: The tenth value**
- **Value:** 2.8
- **Analysis:** Similar to the second value, within typical range.
- **Conclusion:** No.
**Verdict:** No.
---
### **Option F: The fourth value**
- **Value:** 1.2
- **Analysis:** The lowest value but still plausible as a data point.
- **Conclusion:** Not irregular unless context suggests otherwise.
**Verdict:** No.
---
### **Option G: The eighth value**
- **Value:** 5.3
- **Analysis:** Within the normal variation.
- **Conclusion:** No.
**Verdict:** No.
---
### **Option H: The ninth value**
- **Value:** 5.5
- **Analysis:** Similar to above; no irregularity.
- **Verdict:** No.
---
### **Option I: The first value**
- **Value:** 3.1
- **Analysis:** Typical value, no irregularity.
- **Verdict:** No.
---
### **Option J: The fifth value**
- **Value:** 3.2
- **Analysis:** Normal, within the common range.
- **Verdict:** No.
---
### **Final Summary:**
- The **only potential irregularity** is the **sixth value (1076)**, which is **significantly higher** than all other data points.
---
## **Final Answer:**
**The irregularities are in:**
- **A. The sixth value**
---
## **Explanation:**
The sixth data point (1076 GB) is an extreme outlier compared to the rest of the data, which mostly lies between 1.2 and 7.3 GB. Such a large discrepancy suggests it could be a data entry error, measurement anomaly, or an extreme case worth investigating.
---
**Hence, the correct choice is:**
**A. The sixth value**
Question:
i need detailed calculations along with the final Answer
This is AI generated Response.
Asked by: gvr
Created at: 2025-06-25 08:05:56
Asked by: gvr
Created at: 2025-06-25 08:05:56
Final Answer:
Rendered
Raw Text
Did you like this answer?
Let's analyze the data systematically to identify potential irregularities (outliers). The dataset (in GB) is:
**Data:** 3.1, 2.9, 5.8, 1.2, 3.2, 1076, 7.3, 5.3, 5.5, 2.8
---
### **Step 1: Understand the data**
Most data points are between 1.2 and 7.3 GB, with a single very large value: 1076 GB.
---
### **Step 2: Calculate basic statistics**
**a. Mean (average):**
\[
\text{Sum} = 3.1 + 2.9 + 5.8 + 1.2 + 3.2 + 1076 + 7.3 + 5.3 + 5.5 + 2.8
\]
\[
\text{Sum} = (3.1 + 2.9) + 5.8 + 1.2 + 3.2 + 1076 + 7.3 + 5.3 + 5.5 + 2.8
\]
Calculations:
- \(3.1 + 2.9 = 6.0\)
- Sum so far: \(6.0 + 5.8 = 11.8\)
- Add 1.2: \(11.8 + 1.2 = 13.0\)
- Add 3.2: \(13.0 + 3.2 = 16.2\)
- Add 1076: \(16.2 + 1076 = 1092.2\)
- Add 7.3: \(1092.2 + 7.3 = 1099.5\)
- Add 5.3: \(1099.5 + 5.3 = 1104.8\)
- Add 5.5: \(1104.8 + 5.5 = 1109.3\)
- Add 2.8: \(1109.3 + 2.8 = 1112.1\)
**Mean:**
\[
\bar{x} = \frac{1112.1}{10} = 111.21 \text{ GB}
\]
---
**b. Standard deviation (σ):**
Calculate squared deviations:
\[
\text{Deviations}^2 = \sum (x_i - \bar{x})^2
\]
Calculate each:
| Value | \(x_i\) | \(x_i - \bar{x}\) | \((x_i - \bar{x})^2\) |
|---------|---------|-------------------|------------------------|
| 1 | 3.1 | 3.1 - 111.21 = -108.11 | 11689.8 |
| 2 | 2.9 | -108.31 | 11755.4 |
| 3 | 5.8 | -105.41 | 11123.8 |
| 4 | 1.2 | -109.01 | 11883.2 |
| 5 | 3.2 | -108.01 | 11666.2 |
| 6 | 1076 | -964.81 | 930915.1 |
| 7 | 7.3 | -103.91 | 10805.3 |
| 8 | 5.3 | -105.91 | 11225.3 |
| 9 | 5.5 | -105.71 | 11155.9 |
| 10 | 2.8 | -108.41 | 11766.2 |
Now, sum the squared deviations:
\[
\sum (x_i - \bar{x})^2 \approx 11689.8 + 11755.4 + 11123.8 + 11883.2 + 11666.2 + 930915.1 + 10805.3 + 11225.3 + 11155.9 + 11766.2
\]
Adding sequentially:
- 11689.8 + 11755.4 = 23445.2
- +11123.8 = 34569.0
- +11883.2 = 46452.2
- +11666.2 = 58118.4
- +930915.1 = 989033.5
- +10805.3 = 999838.8
- +11225.3 = 1012064.1
- +11155.9 = 1023219.9
- +11766.2 = 1034986.1
**Variance:**
\[
s^2 = \frac{\sum (x_i - \bar{x})^2}{n - 1} = \frac{1034986.1}{9} \approx 115000.68
\]
**Standard deviation:**
\[
\sigma = \sqrt{115000.68} \approx 339.17 \text{ GB}
\]
---
### **Step 3: Identify outliers using the 1.5 * IQR rule**
Alternatively, since the mean and standard deviation are heavily influenced by the outlier, let's consider the **Interquartile Range (IQR)** method for robustness.
**Order data:**
1.2, 2.8, 2.9, 3.1, 3.2, 5.3, 5.5, 5.8, 7.3, 1076
**Q1 (25th percentile):**
- Median of first 5 data points: (2.8, 2.9, 3.1, 3.2, 5.3)
- Q1 is between 2.9 and 3.1:
\[
Q1 = 2.9 + 0.25 \times (3.1 - 2.9) = 2.9 + 0.25 \times 0.2 = 2.9 + 0.05 = 2.95
\]
**Q3 (75th percentile):**
- Median of last 5 data points: (5.5, 5.8, 7.3, 1076)
- Q3 between 5.8 and 7.3:
\[
Q3 = 5.8 + 0.75 \times (7.3 - 5.8) = 5.8 + 0.75 \times 1.5 = 5.8 + 1.125 = 6.925
\]
**Calculate IQR:**
\[
\text{IQR} = Q3 - Q1 = 6.925 - 2.95 = 3.975
\]
**Determine lower and upper bounds:**
- Lower bound: \(Q1 - 1.5 \times IQR = 2.95 - 1.5 \times 3.975 = 2.95 - 5.9625 = -3.0125\)
- Upper bound: \(Q3 + 1.5 \times IQR = 6.925 + 5.9625 = 12.8875\)
Any data point **below -3.0125** or **above 12.8875**** is considered an outlier. Since all data points are positive, only the upper bound matters.
Our data points:
- All are less than 12.8875, **except** the 1076 GB value, which is way above.
---
### **Step 4: Conclusion**
- The only data point outside the upper bound (12.89) is **1076** GB, indicating it is a **potential outlier**.
---
### **Final Answer:**
**The irregularity is in:**
- **A. The sixth value**
because **1076 GB** is an extreme outlier, vastly different from the rest of the data.
---
### **Summary:**
- **Calculations show** that all data points are within typical ranges **except** the sixth value.
- Using **mean and standard deviation**, the sixth value is over 3 standard deviations away—another sign of an outlier.
- Using the **IQR method**, the sixth value exceeds the upper bound by a large margin.
**Thus, the only irregularity (potential outlier) is the sixth data point.**
---
**Final choice:**
**A. The sixth value**
📢 Instructions:
- Ask anything relatd to above question only.
- For new Question goto :