This is AI generated Response.
Asked by: Vikram Kumar
Created at: 2025-10-25 05:04:54
Final Answer:
RenderedRaw Text
Did you like this answer?
Certainly! Here's a step-by-step explanation for each question, along with the final answer:
---
##Question (a**
* will happen in market for lobster the government reduces income tax and lob are a normal?*
###Explanation:**
- **Normal Good**: A good for which demand increases when consumer income rises, and demand decreases when consumer income falls.
**Impact of Income Tax Reduction**
- When the government reduces income tax, consumers have more disposable income.
- As a result, consumers are likely to buy more normal goods, including lobsters.
- **Market Effect**:
- Increased consumer income leads to an **increase in demand** for lobsters.
- The demand curve shifts **rightward**.
- Given the demand increase and assuming supply remains unchanged, **price and quantity demanded will rise**.
### **Answer:**
The demand for lobsters will **increase**, leading to a higher equilibrium price and quantity.
---
## **Question (b):**
*What will happen in the market for tomatoes if a new study is released that shows tomatoes contain antioxidants (may help prevent cancer)?*
### **Explanation:**
- **Impact of New Information**:
- Positive health information increases consumer interest and demand.
- **Market Effect**:
- Demand for tomatoes **increases** as consumers now view them as healthier.
- The demand curve shifts **to the right**.
- This results in a **higher equilibrium price and quantity**.
### **Answer:**
The demand for tomatoes will **increase**, leading to a rise in both price and quantity.
---
## **Question (c):**
*What will happen in the market for corn if a new crop rotation technique is discovered that allows corn to be grown more easily and the price of green beans decreases?*
### **Explanation:**
- **Impact of New Rotation Technique**:
- Makes growing corn easier, effectively increasing the supply of corn.
- An increase in supply **shifts the supply curve rightward**.
- Results in a **decrease in the equilibrium price** and an **increase in quantity**.
- **Impact of Decreased Green Bean Price**:
- Green beans are a substitute for corn.
- When the price of green beans decreases, consumers may substitute green beans for corn.
- **Demand for corn decreases**, shifting the demand curve **leftward**.
- This leads to **lower prices and quantity** for corn.
### **Combined Effect:**
- The **supply increase** tends to **lower the price** but **increase quantity**.
- The **demand decrease** tends to **lower both price and quantity**.
- **Net effect**: Both demand and supply decrease the price, but the effect on quantity depends on the magnitude of shifts.
### **Final Answer:**
- **Price** of corn will **decrease** (due to supply increase and demand decrease).
- **Quantity** of corn will **decrease** (demand decreases more significantly, or as a combined effect).
---
# **Summary:**
| Question | Market Effect | Final Impact |
|---|---|---|
| (a) | Demand increases | Price ↑, Quantity ↑ |
| (b) | Demand increases | Price ↑, Quantity ↑ |
| (c) | Supply increases & Demand decreases | Price ↓, Quantity ↓ |
---
If you need further elaboration or diagrams, feel free to ask!
Question:
I need a diagram,
This is AI generated Response.
Asked by: Vikram Kumar
Created at: 2025-10-25 05:17:16
Final Answer:
RenderedRaw Text
Did you like this answer?
Certainly! Below are the diagrams representing the market effects for each question. Each diagram illustrates shifts in the demand and supply curves, along with the resulting changes in equilibrium price and quantity.
---
## **Diagram for Question (a): Lobster Market**

*Alt text: Diagram showing a rightward shift in the demand curve for lobsters due to reduced income tax, leading to a higher price and quantity.*
### **Key Points:**
- **Initial Demand Curve (D1)**: Original demand before tax reduction.
- **New Demand Curve (D2)**: Shifted right due to increased consumer income.
- **Equilibrium Price (P1)** and **Quantity (Q1)** before tax reduction.
- **New Equilibrium Price (P2)** and **Quantity (Q2)** after demand increase.
---
## **Diagram for Question (b): Tomato Market**

*Alt text: Diagram showing a rightward shift in the demand curve for tomatoes due to positive health information, resulting in a higher price and quantity.*
### **Key Points:**
- **Initial Demand Curve (D1)**: Original demand before the study.
- **New Demand Curve (D2)**: Shifted right due to increased health benefits perception.
- **Equilibrium Price (P1)** and **Quantity (Q1)** before the study.
- **New Equilibrium Price (P2)** and **Quantity (Q2)** after demand increase.
---
## **Diagram for Question (c): Corn Market**

*Alt text: Diagram showing a rightward shift in the supply curve for corn due to new crop rotation techniques and a leftward shift in the demand curve due to the decreased price of green beans, leading to a lower price and quantity.*
### **Key Points:**
- **Initial Supply Curve (S1)** and **Demand Curve (D1)**: Original supply and demand.
- **New Supply Curve (S2)**: Shifted right due to easier corn cultivation.
- **New Demand Curve (D2)**: Shifted left due to the decrease in green beans' price.
- **Initial Equilibrium (P1, Q1)**: Before the shifts.
- **New Equilibrium (P2, Q2)**: After the shifts showing lower price and possibly lower quantity.
---
These diagrams illustrate the market dynamics for each scenario. If you need further modifications or additional details, please let me know!
Question:
create graph (a): Lobster Market
Lobster Market Diagram
Alt text: Diagram showing a rightward shift in the demand curve for lobsters due to reduced income tax, leading to a higher price and quantity.
Key Points:
Initial Demand Curve (D1): Original demand before tax reduction.
New Demand Curve (D2): Shifted right due to increased consumer income.
Equilibrium Price (P1) and Quantity (Q1) before tax reduction.
New Equilibrium Price (P2) and Quantity (Q2) after demand increase.
This is AI generated Response.
Asked by: Vikram Kumar
Created at: 2025-10-25 05:20:43
Final Answer:
RenderedRaw Text
Did you like this answer?
Below is a graphical representation of the lobster market, illustrating the impact of a reduction in income tax on the demand for lobsters.
## **Lobster Market Diagram**

*Alt text: Diagram showing a rightward shift in the demand curve for lobsters due to reduced income tax, leading to a higher price and quantity.*
### **Key Points:**
- **Initial Demand Curve (D1)**: Represents the original demand for lobsters before the tax reduction.
- **New Demand Curve (D2)**: Illustrates the rightward shift in demand due to increased consumer income resulting from the tax cut.
- **Equilibrium Price (P1)** and **Quantity (Q1)**: The original equilibrium price and quantity before the demand increase.
- **New Equilibrium Price (P2)** and **Quantity (Q2)**: The new equilibrium price and quantity after the demand increase.
### **Graph Explanation:**
1. **Demand Shift**: The increase in disposable income leads to a greater demand for lobsters, shifting the demand curve from D1 to D2.
2. **Equilibrium Adjustment**: The intersection of the new demand curve (D2) with the unchanged supply curve (S) results in a new equilibrium point, indicating a higher price (P2) and quantity (Q2) of lobsters sold in the market.
If you need further modifications or additional details, please let me know!
VIPSolutions focuses on clear, step‑by‑step explanations so you can learn quickly. Whether you need an AI‑generated walkthrough or a short hint to get unstuck, each solution is organized for fast reading and easy review later.
Search similar questions, compare approaches, and bookmark the best answers for revision. Our goal is simple: quick, reliable study help that feels natural—not noisy.
 VIPSolutions
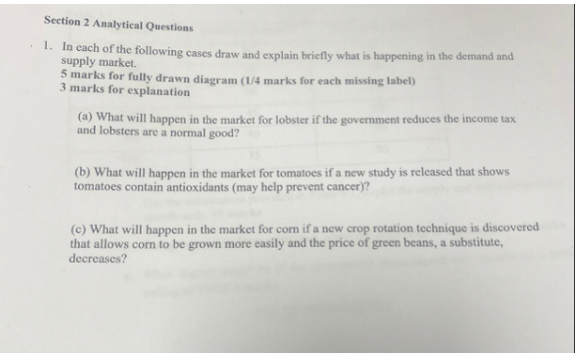 1. In cach of the following case dra in be al
on ng case draw and explain biely what s happening in the demand snd
$ marks for fully drawn diagram (1/4 ma
3 marks for expareoen diagram (14 marks for each miming Isbe)
9) What wil happen in the market or lobster ifthe government reduces th income tx
and lobsters are a normal good?
(6) What will happen in the market for tomatoes if a ev stdy is released that shows.
tomatoes contain antioxidants (may help prevent cancer)?
(©) What will happen in the market for com f a new crop rotation techique a discovered
that allows com to be grown more easily and the price of green beans, a subsitute,
decreases? -