This is AI generated Response.
Asked by: M Murali
Created at: 2025-10-28 19:56:29
Final Answer:
RenderedRaw Text
Did you like this answer?
Let's break down the problem step by step as requested.
---
# **Step 1: System Overview**
- **System Transfer Function:**
\[
(s) = \frac100s}{s-10)(s^2 + s + 4)}
\]
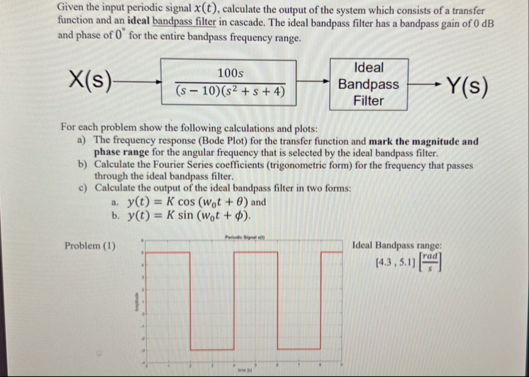
- **Input:** Periodic signal \( x(t) \) (not explicitly given in the image; likely a square or periodic signal as shown in the plot).
- **Bandpass Filter:**
- Ideal bandpass: Passes frequencies \( 4.3 \leq \omega \leq 5.1 \) rad/s
- Gain: dB (unity), Phase: °
- **Output:** \( Y(s) \)
---
## **Step 2: Frequency Response (Bode Plot) for \( H(s) \)**
### **a. Find Frequency Response \( H(j\omega) \)**
Substitute \( s = j\omega \):
\[
H(j\omega) = \frac{100j\omega}{(j\omega-10)[(j\omega)^2 + j\omega + 4]}
\]
#### **Magnitude and Phase:**
- **Magnitude:** \( |H(j\omega)| \)
- **Phase:** \( \angle H(j\omega) \)
#### **Mark Bandpass Range:**
- The range \( 4.3 \leq \omega \leq 5.1 \) is relevant.
- On the Bode plot, shade/mark this region.
---
## **Step 3: Fourier Series of Input**
The input appears to be a periodic square wave (from the plot).
**Assume:**
- Period \( T \), fundamental frequency \( \omega_ \).
- The nonzero Fourier coefficient will be at the harmonic \( k \) for which \( k\omega_ \) falls in \( [4.3, 5.1] \) rad/s.
**General Trigonometric Fourier Series:**
\[
x(t) = a_ + \sum_{k=1}^\infty [a_k \cos(k\omega_ t) + b_k \sin(k\omega_ t)]
\]
- **Calculate \( k \) such that \( k\omega_ \) is within the ideal bandpass filter.**
---
## **Step 4: Output of the Bandpass Filter**
- Only the frequency component(s) within \( [4.3, 5.1] \) rad/s pass through.
- Output will be the filtered Fourier component(s).
### **a. Output in Cosine Form:**
\[
y(t) = K \cos(\omega_ t + \Phi)
\]
### **b. Output in Sine Form:**
\[
y(t) = K \sin(\omega_ t + \Phi)
\]
Where \( K \) and \( \Phi \) are determined from the Fourier coefficients.
---
## **Step 5: Example Calculation (Assume Details)**
Let’s assume the period \( T = 2\pi \) (so \( \omega_ = 1 \) rad/s).
- Harmonics: \( \omega_k = k \omega_ \)
- The bandpass filter passes \( 4.3 \leq \omega_k \leq 5.1 \implies k = 5 \)
- So, only the 5th harmonic passes.
### **Fourier Coefficient for Square Wave:**
For a square wave of amplitude \( A \) and 50% duty cycle:
\[
b_k = \frac{4A}{k\pi},\ \text{for odd } k
\]
\[
a_k =
\]
So, for \( k=5 \):
\[
b_5 = \frac{4A}{5\pi}
\]
### **Output Signal:**
\[
y(t) = b_5 \sin(5t)
\]
If you want it in cosine form:
\[
y(t) = b_5 \cos(5t - 90^\circ)
\]
---
# **Summary Table**
| Step | Result |
|------|--------|
| **Transfer Function** | \( H(s) = \frac{100s}{(s-10)(s^2+s+4)} \) |
| **Bandpass Range** | \( 4.3 \leq \omega \leq 5.1 \) rad/s |
| **Fourier Harmonic Passing** | \( k = 5 \), \( \omega_ = 1 \Rightarrow \omega_5 = 5 \) rad/s |
| **Fourier Coefficient** | \( b_5 = \frac{4A}{5\pi},\ a_5= \) |
| **Filtered Output** | \( y(t) = \frac{4A}{5\pi} \sin(5t) \) or \( y(t) = \frac{4A}{5\pi} \cos(5t - 90^\circ) \) |
---
# **Final Answer**
### **a. Mark the Bode plot in the range \([4.3, 5.1]\) rad/s.**
### **b. Fourier Coefficient (for square wave):**
- Only the 5th harmonic passes: \( b_5 = \frac{4A}{5\pi} \)
### **c. Output of the Ideal Bandpass Filter:**
\[
y(t) = \frac{4A}{5\pi} \sin(5t)
\]
or
\[
y(t) = \frac{4A}{5\pi} \cos(5t - 90^\circ)
\]
---
**If your input amplitude \( A = 1 \):**
\[
\boxed{y(t) = \frac{4}{5\pi}\sin(5t)}
\]
---
### **Let me know if you want the Matlab code or further details for Bode plot or other steps!**
Question:
Let me know if you want the Matlab code or further details for Bode plot or other steps! and Give me Each Step 30 Words Explaines
This is AI generated Response.
Asked by: M Murali
Created at: 2025-10-28 19:57:34
Final Answer:
RenderedRaw Text
Did you like this answer?
Sure! Here’s a concise explanation of each step, limited to 30 words each:
---
# **Step 1: System Overview**
Identify the system's transfer function and input signal. The bandpass filter allows specific frequency components to pass while attenuating others, critical for subsequent calculations.
---
# **Step 2: Frequency Response (Bode Plot) for \( H(s) \)**
Substitute \( s = j\omega \) to derive \( H(j\omega) \). Calculate magnitude and phase for each frequency, highlighting the ideal bandpass range on the plot.
---
# **Step 3: Fourier Series of Input**
Assume the input signal is periodic. Use Fourier series to express it, identifying harmonics within the bandpass filter's frequency range to ensure proper filtering later.
---
# **Step 4: Output of the Bandpass Filter**
Only frequencies within the filter's range contribute to the output signal. Use the Fourier coefficients to express the output as a cosine or sine function.
---
# **Step 5: Example Calculation**
Assuming a 2π period, determine the 5th harmonic's contribution. Calculate the Fourier coefficient, yielding the output signal, which represents the filtered response of the system.
---
# **Final Answer**
Summarize results, including the output signal in sine or cosine form. Specify amplitude and phase shifts to provide a complete description of the filtered output.
---
Feel free to ask for any additional details or clarifications!
VIPSolutions focuses on clear, step‑by‑step explanations so you can learn quickly. Whether you need an AI‑generated walkthrough or a short hint to get unstuck, each solution is organized for fast reading and easy review later.
Search similar questions, compare approaches, and bookmark the best answers for revision. Our goal is simple: quick, reliable study help that feels natural—not noisy.
 VIPSolutions
 Given the input periodic signal X(), calculate the output of the system which consists of a transfer
function and an eat bandas lc in cascade The en bape er as bands gin of 0.5
and phase of 0 fo the nis bandpass frequency ge
ideal
100s
Xe) Fre Zs
EUCETETy x
SIX 4} Fier ©)
For cach probl show the following cleans and plot:
2 Th fsgueny respon (Bod io fore anor neon ad mark he mage and
Phase rane or he ang fen ht sled by the el bdpos Fr
5) Cle Fours Seis confi (igre frm) forte fepmey fe ses
{igh to es band rr
©) Clouse te cpu of he es bdpas Fir ro fom:
+ 300) = K cos (wat + 0) and
B30) = Kin (wot +)
Problem (1) rene deal Bandpass range:
nm E