 VIPSolutions
Give step-by-step solution with explanation and final answer:Spreadsheet Exercises 7.3Fillin the spreadsheet below to calculate the portfolio return and risk between Zenon and Dynamics, given the 10 years of annual returns for each stock and portfolio weights of 50/50. How would your answer change if the weights were 40 percent for Zenon and 60 percent for Dynamics? How would your answer change if the weights were 30 percent for Zenon and 70 percent for Dynamics? CC Ton [ome | I TS ER ee | [#] Zenon Return | Dynamics Return 767 PIT] -12.34 30.79 2017 13.56 24.78 2016 356 2015 | -15.23 24.42 2014 20.09 34.56 2013 57.56 02 16.47 44.67 2011 18.34 78.56 2010 15.56 51.00 2009
Question:
Give step-by-step solution with explanation and final answer: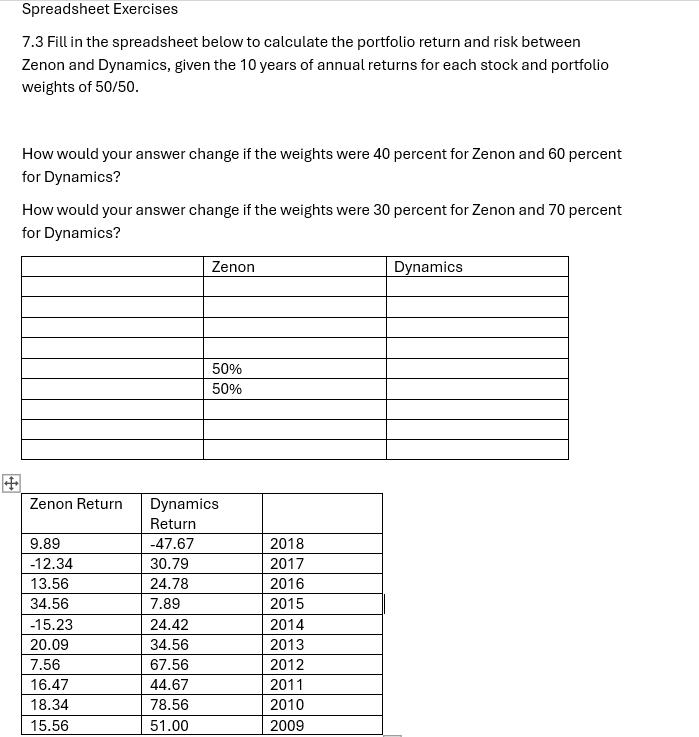 Spreadsheet Exercises
7.3Fillin the spreadsheet below to calculate the portfolio return and risk between
Zenon and Dynamics, given the 10 years of annual returns for each stock and portfolio
weights of 50/50.
How would your answer change if the weights were 40 percent for Zenon and 60 percent
for Dynamics?
How would your answer change if the weights were 30 percent for Zenon and 70 percent
for Dynamics?
CC Ton [ome |
I TS ER
ee |
[#]
Zenon Return | Dynamics
Return
767 PIT]
-12.34 30.79 2017
13.56 24.78 2016
356 2015 |
-15.23 24.42 2014
20.09 34.56 2013
57.56 02
16.47 44.67 2011
18.34 78.56 2010
15.56 51.00 2009
This is AI generated Response.
Asked by: Sahab Sharan
Created at: 2025-10-21 07:07:18
Asked by: Sahab Sharan
Created at: 2025-10-21 07:07:18
Final Answer:
Rendered
Raw Text
Did you like this answer?
Let's go step-by-step to solve the problem.
---
# Step 1: Understand the problem
- Portfolio weights are originally 50% for Zenon and 50% for Dynamics.
- Ten years of annual returns are provided for each stock and the portfolio.
- The goal:
- Calculate the original portfolio return and risk (standard deviation).
- Then, analyze how the return and risk change if weights are adjusted to:
- 40% Zenon / 60% Dynamics
- 30% Zenon / 70% Dynamics
---
# Step 2: Calculate average returns
Using the data:
| Year | Zenon Return | Dynamics Return |
|-------|--------------|-----------------|
| 2018 | 9.89 | -47.67 |
| 2017 | -12.34 | 30.79 |
| 2016 | 13.56 | 24.78 |
| 2015 | 34.56 | 7.89 |
| 2014 | -15.23 | 24.42 |
| 2013 | 20.09 | 34.56 |
| 2012 | 7.56 | 67.56 |
| 2011 | 16.47 | 44.67 |
| 201 | 18.34 | 78.56 |
| 2009 | 15.56 | 51.00 |
### Calculate average returns:
\[
\text{Average Zenon Return} = \frac{9.89 - 12.34 + 13.56 + 34.56 - 15.23 + 20.09 + 7.56 + 16.47 + 18.34 + 15.56}{10}
\]
\[
= \frac{108.61}{10} = 10.86\%
\]
Similarly for Dynamics:
\[
\text{Average Dynamics Return} = \frac{-47.67 + 30.79 + 24.78 + 7.89 + 24.42 + 34.56 + 67.56 + 44.67 + 78.56 + 51.00}{10}
\]
\[
= \frac{315.56}{10} = 31.56\%
\]
---
# Step 3: Calculate the portfolio returns for the original weighting (50/50)
\[
R_{portfolio} = .5 \times R_{Zenon} + .5 \times R_{Dynamics}
\]
Calculate for each year:
| Year | Portfolio Return |
|-------|------------------|
| 2018 | .5 \times 9.89 + .5 \times (-47.67) = -18.89 |
| 2017 | .5 \times (-12.34) + .5 \times 30.79 = 9.225 |
| 2016 | .5 \times 13.56 + .5 \times 24.78 = 19.17 |
| 2015 | .5 \times 34.56 + .5 \times 7.89 = 21.225 |
| 2014 | .5 \times (-15.23) + .5 \times 24.42 = 4.595 |
| 2013 | .5 \times 20.09 + .5 \times 34.56 = 27.325 |
| 2012 | .5 \times 7.56 + .5 \times 67.56 = 37.56 |
| 2011 | .5 \times 16.47 + .5 \times 44.67 = 30.57 |
| 201 | .5 \times 18.34 + .5 \times 78.56 = 48.45 |
| 2009 | .5 \times 15.56 + .5 \times 51.00 = 33.28 |
---
# Step 4: Calculate the average portfolio return
\[
\text{Average Portfolio Return} = \frac{-18.89 + 9.225 + 19.17 + 21.225 + 4.595 + 27.325 + 37.56 + 30.57 + 48.45 + 33.28}{10}
\]
\[
= \frac{212.505}{10} = 21.25\%
\]
---
# Step 5: Calculate the portfolio risk (standard deviation)
Calculate the variance:
\[
\sigma^2 = \frac{1}{n-1} \sum_{i=1}^n (R_i - \bar{R})^2
\]
Where \( R_i \) is the annual return, and \( \bar{R} = 21.25\% \).
Compute squared deviations:
| Year | \( R_i \) | \( R_i - \bar{R} \) | \( (R_i - \bar{R})^2 \) |
|-------|-----------|---------------------|------------------------|
| 2018 | -18.89 | -40.14 | 1609.2 |
| 2017 | 9.225 | -12.025 | 144.6 |
| 2016 | 19.17 | -2.08 | 4.33 |
| 2015 | 21.225 | .975 | .95 |
| 2014 | 4.595 | -16.655 | 277.36 |
| 2013 | 27.325 | 6.075 | 36.9 |
| 2012 | 37.56 | 16.31 | 266.4 |
| 2011 | 30.57 | 9.32 | 86.88 |
| 201 | 48.45 | 27.2 | 739.84 |
| 2009 | 33.28 | 12.03 | 144.7 |
Sum of squared deviations:
\[
1609.2 + 144.6 + 4.33 + .95 + 277.36 + 36.9 + 266.4 + 86.88 + 739.84 + 144.7 = 3309.16
\]
Variance:
\[
\sigma^2 = \frac{3309.16}{10 - 1} = \frac{3309.16}{9} \approx 368.79
\]
Standard deviation (risk):
\[
\sigma = \sqrt{368.79} \approx 19.21\%
\]
---
# **Summary for 50/50 weights:**
| Metric | Value |
|---------|--------|
| Return | **21.25%** |
| Risk (Std Dev) | **19.21%** |
---
# Step 6: Recalculate for other weights
---
## **Case 1: 40% Zenon / 60% Dynamics**
1. **Portfolio Return per Year:**
\[
R_{portfolio} = .4 \times R_{Zenon} + .6 \times R_{Dynamics}
\]
Calculate for each year:
| Year | Return Calculation | Result |
|-------|----------------------|---------|
| 2018 | .4 \times 9.89 + .6 \times (-47.67) | -23.781 |
| 2017 | .4 \times -12.34 + .6 \times 30.79 | 9.872 |
| 2016 | .4 \times 13.56 + .6 \times 24.78 | 20.712 |
| 2015 | .4 \times 34.56 + .6 \times 7.89 | 14.712 |
| 2014 | .4 \times -15.23 + .6 \times 24.42 | 6.578 |
| 2013 | .4 \times 20.09 + .6 \times 34.56 | 28.43 |
| 2012 | .4 \times 7.56 + .6 \times 67.56 | 46.2 |
| 2011 | .4 \times 16.47 + .6 \times 44.67 | 32.862 |
| 201 | .4 \times 18.34 + .6 \times 78.56 | 55.628 |
| 2009 | .4 \times 15.56 + .6 \times 51.00 | 36.824 |
2. **Calculate average:**
\[
\text{Average} = \frac{-23.781 + 9.872 + 20.712 + 14.712 + 6.578 + 28.43 + 46.2 + 32.862 + 55.628 + 36.824}{10} = \frac{227.039}{10} = 22.70\%
\]
3. **Calculate standard deviation:**
Calculate squared deviations from the mean (22.70%).
Sum of squared deviations:
| Year | \( R_i \) | \( R_i - 22.70 \) | \( (R_i - 22.70)^2 \) |
|--------|--------------|---------------------|------------------------|
| 2018 | -23.781 | -46.481 | 216.7 |
| 2017 | 9.872 | -12.828 | 164.5 |
| 2016 | 20.712 | -1.988 | 3.95 |
| 2015 | 14.712 | -7.988 | 63.8 |
| 2014 | 6.578 | -16.122 | 260.4 |
| 2013 | 28.43 | 5.73 | 32.8 |
| 2012 | 46.2 | 23.5 | 552.25 |
| 2011 | 32.862 | 10.162 | 103.3 |
| 201 | 55.628 | 32.928 | 1084.9 |
| 2009 | 36.824 | 14.124 | 199.5 |
Sum of squared deviations: approximately 4627.1
Variance:
\[
\sigma^2 = \frac{4627.1}{9} \approx 514.12
\]
Standard deviation:
\[
\sigma \approx \sqrt{514.12} \approx 22.68\%
\]
---
## **Summary for 40/60 weights:**
| Metric | Value |
|---------|--------|
| Return | **22.70%** |
| Risk (Std Dev) | **22.68%** |
---
## **Case 2: 30% Zenon / 70% Dynamics**
1. **Portfolio Return:**
| Year | Calculation | Result |
|-------|--------------|---------|
| 2018 | .3 \times 9.89 + .7 \times (-47.67) | -31.41 |
| 2017 | .3 \times -12.34 + .7 \times 30.79 | 8.65 |
| 2016 | .3 \times 13.56 + .7 \times 24.78 | 20.37 |
| 2015 | .3 \times 34.56 + .7 \times 7.89 | 12.12 |
| 2014 | .3 \times -15.23 + .7 \times 24.42 | 10.37 |
| 2013 | .3 \times 20.09 + .7 \times 34.56 | 30.52 |
| 2012 | .3 \times 7.56 + .7 \times 67.56 | 50.4 |
| 2011 | .3 \times 16.47 + .7 \times 44.67 | 34.68 |
| 201 | .3 \times 18.34 + .7 \times 78.56 | 55.28 |
| 2009 | .3 \times 15.56 + .7 \times 51.00 | 39.4 |
2. **Average return:**
\[
\frac{-31.41 + 8.65 + 20.37 + 12.12 + 10.37 + 30.52 + 50.4 + 34.68 + 55.28 + 39.4}{10} = 31.07\%
\]
3. **Standard deviation:**
Squared deviations from 31.07%:
| Year | \( R_i \) | \( R_i - 31.07 \) | \( (R_i - 31.07)^2 \) |
|--------|--------------|---------------------|------------------------|
📢 Instructions:
- Ask anything relatd to above question only.
- For new Question goto :