 VIPSolutions
Give step-by-step solution with explanation and final answer:3. Assume an inverse market demand function P = 60 — Q facing an ordinary monopoly. Provide the equation of the marginal revenue (MR) function of the monopolist. Ifa monopoly firm increased its output from 30 units to 31 units, show graphically what the MR of the 31* unit of output would be, graphically identifying the negative component of MR; and the positive component of MRy;. Overall, which component is larger? What is the numerical value of MRs?
Question:
Give step-by-step solution with explanation and final answer: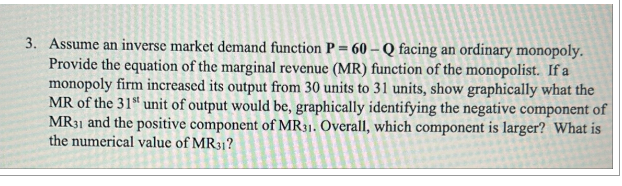 3. Assume an inverse market demand function P = 60 — Q facing an ordinary monopoly.
Provide the equation of the marginal revenue (MR) function of the monopolist. Ifa
monopoly firm increased its output from 30 units to 31 units, show graphically what the
MR of the 31* unit of output would be, graphically identifying the negative component of
MR; and the positive component of MRy;. Overall, which component is larger? What is
the numerical value of MRs?
This is AI generated Response.
Asked by: Vikram Kumar
Created at: 2025-10-01 02:35:58
Asked by: Vikram Kumar
Created at: 2025-10-01 02:35:58
Final Answer:
Rendered
Raw Text
Did you like this answer?
Let's solve this step-by-step:
---
## 1. **Inverse Demand Function**
Given:
\[
P = 60 - Q
\]
---
## 2. **Total Revenue (TR) Function**
Total Revenue = \( P \times Q \)
\[
TR = (60 - Q) Q = 60Q - Q^2
\]
---
## 3. **Marginal Revenue (MR) Function**
Marginal Revenue is the derivative of TR with respect to Q:
\[
MR = \frac{d(TR)}{dQ} = \frac{d}{dQ}(60Q - Q^2) = 60 - 2Q
\]
**Equation of the MR function:**
\[
\boxed{MR = 60 - 2Q}
\]
---
## 4. **Calculate MR for the 31st Unit**
We want the MR when output increases from 30 to 31 units.
Plug \( Q = 31 \) into the MR function:
\[
MR_{31} = 60 - 2 \times 31 = 60 - 62 = -2
\]
---
## 5. **Graphically Identifying Components**
When output increases by 1 unit (from 30 to 31):
### Total Revenue Change:
\[
\Delta TR = TR(31) - TR(30)
\]
\[
TR(31) = (60 - 31) \times 31 = 29 \times 31 = 899
\]
\[
TR(30) = (60 - 30) \times 30 = 30 \times 30 = 900
\]
\[
\Delta TR = 899 - 900 = -1
\]
### Decomposition into Components:
- **Positive component:** Revenue from selling the 31st unit at the new price = \( P(31) = 29 \)
- **Negative component:** Revenue lost due to lowering the price on all previous 30 units.
- Price drop per unit: \( P(31) - P(30) = 29 - 30 = -1 \)
- Revenue lost: \( 30 \times -1 = -30 \)
#### So:
\[
\Delta TR = \text{Positive component} + \text{Negative component} = 29 + (-30) = -1
\]
---
## 6. **Which Component is Larger?**
- The negative component (\(-30\)) is larger in magnitude than the positive component (\(29\)).
---
## 7. **Summary Table**
| Component | Value |
|-------------------------------|-------|
| Positive (from 31st unit) | 29 |
| Negative (lost on first 30) | -30 |
| **Total (MR\(_{31}\))** | -1 |
---
## 8. **Final Answers**
**a) MR Equation:**
\[
\boxed{MR = 60 - 2Q}
\]
**b) Numerical value of MR\(_{31}\):**
\[
\boxed{-2}
\]
**c) Positive component:** 29
**d) Negative component:** -30
**e) Which component is larger?**
The **negative component** is larger in magnitude.
---
## 9. **Graphical Representation (Described)**
- **Positive component:** Height of the demand curve at \( Q = 31 \) (i.e., 29).
- **Negative component:** Area representing the revenue lost on the first 30 units due to the price drop.
- **MR:** Net change in total revenue, which is negative.
---
### **Summary**
- **Marginal Revenue function:** \( MR = 60 - 2Q \)
- **MR at 31st unit:** \( -2 \)
- **Positive component:** \( 29 \)
- **Negative component:** \( -30 \)
- **Negative component is larger in magnitude.**
Question:
create graph and this quetion micro economic or macro economic
This is AI generated Response.
Asked by: Vikram Kumar
Created at: 2025-10-01 02:38:41
Asked by: Vikram Kumar
Created at: 2025-10-01 02:38:41
Final Answer:
Rendered
Raw Text
Did you like this answer?
## Graphical Representation
### Graph Description
1. **X-axis:** Quantity (Q)
2. **Y-axis:** Price (P) and Marginal Revenue (MR)
3. **Demand Curve:** Downward sloping line representing the inverse demand function \( P = 60 - Q \).
4. **Marginal Revenue Curve:** A downward sloping line representing \( MR = 60 - 2Q \).
### Components on the Graph
- **Demand Curve at Q=31:** Show price \( P = 29 \).
- **Area for Positive Component (Revenue from 31st Unit):** A rectangle with height 29 and width 1 unit.
- **Area for Negative Component (Revenue Lost):** A rectangle with height -30 (the price drop impact on 30 units) and width 30 units.
**Note:** An actual graph would visually depict these areas and curves.
---
## Economic Context
This question pertains to **Microeconomics** as it deals with the behavior of a monopolistic firm, its pricing strategy, output decisions, and revenue implications.
### Key Microeconomic Concepts:
- **Monopoly Market Structure:** Analysis of a single seller dominating the market.
- **Demand and Marginal Revenue:** Understanding how demand affects pricing and revenue.
- **Profit Maximization:** The relationship between output levels, price changes, and total revenue.
---
### Conclusion
- The analysis focuses on the monopolist's behavior in response to changes in output and demonstrates fundamental microeconomic principles related to pricing and revenue.
📢 Instructions:
- Ask anything relatd to above question only.
- For new Question goto :