VIPSolutions logo ✨ VIPSolutions

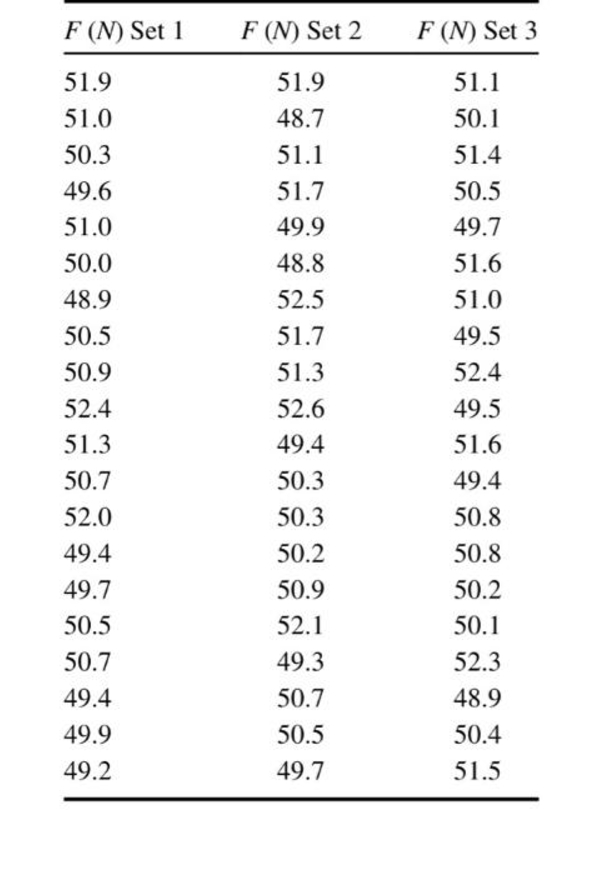
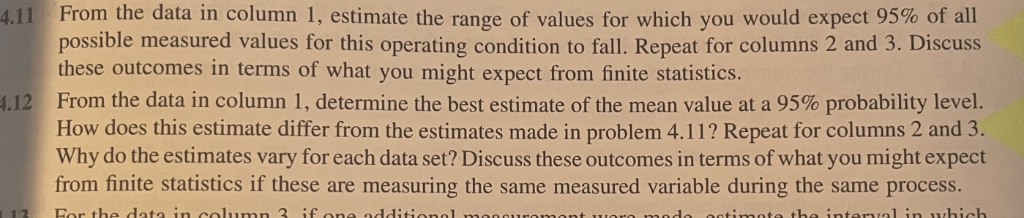
Give step-by-step solution with explanation and final answer:From the data in column 1, estimate the range of values for which you would expect 95% of all possible measured values for this operating condition to fall. Repeat for columns 2 and 3. Discuss EE these outcomes in terms of what you might expect from finite statistics. From the data in column 1, determine the best estimate of the mean value at a 95% probability level. How does this estimate differ from the estimates made in problem 4.11? Repeat for columns 2 and + Why do the estimates vary for each data set? Discuss these outcomes in terms of what you might expect from finite statistics if these are measuring the same measured variable during the same process. Thar tha dota 20 Arnlitome Qe 0 n 0 lg gi o BIE USHERS SL PERETS SFE SE STE ES o FEE w (FS ARIE fy SUSE ait Jae pc Ri SE F(N) Set 1 F (N) Set 2 F(N) Set 3 51.9 51.9 51.1 51.0 48.7 50.1 50.3 51.1 51.4 49.6 51.7 50.5 51.0 49.9 49.7 50.0 48.8 51.6 48.9 52.5 51.0 50.5 51.7 49.5 50.9 51.3 52.4 524 52.6 49.5 51.3 49.4 51.6 50.7 50.3 49.4 52.0 50.3 50.8 49.4 50.2 50.8 49.7 50.9 50.2 50.5 52.1 50.1 50.7 49.3 52.3 49.4 50.7 48.9 49.9 50.5 50.4 49.2 49.7 51.5

Question:

Give step-by-step solution with explanation and final answer:Uploaded ImageUploaded ImageFrom the data in column 1, estimate the range of values for which you would expect 95% of all possible measured values for this operating condition to fall. Repeat for columns 2 and 3. Discuss EE these outcomes in terms of what you might expect from finite statistics. From the data in column 1, determine the best estimate of the mean value at a 95% probability level. How does this estimate differ from the estimates made in problem 4.11? Repeat for columns 2 and + Why do the estimates vary for each data set? Discuss these outcomes in terms of what you might expect from finite statistics if these are measuring the same measured variable during the same process. Thar tha dota 20 Arnlitome Qe 0 n 0 lg gi o BIE USHERS SL PERETS SFE SE STE ES o FEE w (FS ARIE fy SUSE ait Jae pc Ri SE F(N) Set 1 F (N) Set 2 F(N) Set 3 51.9 51.9 51.1 51.0 48.7 50.1 50.3 51.1 51.4 49.6 51.7 50.5 51.0 49.9 49.7 50.0 48.8 51.6 48.9 52.5 51.0 50.5 51.7 49.5 50.9 51.3 52.4 524 52.6 49.5 51.3 49.4 51.6 50.7 50.3 49.4 52.0 50.3 50.8 49.4 50.2 50.8 49.7 50.9 50.2 50.5 52.1 50.1 50.7 49.3 52.3 49.4 50.7 48.9 49.9 50.5 50.4 49.2 49.7 51.5
This is AI generated Response.
Asked by: venkatesh
Created at: 2025-09-29 22:47:27

Final Answer:

Rendered Raw Text
Did you like this answer?
Let's solve **Problems 4.11 and 4.12** step by step using the data from the table. --- # Problem 4.11 **Task:** Estimate the range of values for which you would expect 95% of all possible measured values for each column (Set 1, Set 2, Set 3) to fall. Discuss in terms of finite statistics. ### **Step 1: Calculate Mean (\(\bar{x}\)) and Standard Deviation (\(s\))** #### **Set 1 Values:** 51.9, 51., 50.3, 49.6, 51., 50., 48.9, 50.5, 50.9, 52.4, 51.3, 507, 52., 49.4, 49.7, 50.5, 50.7, 49.4, 49.9, 49.2 - **Mean (\(\bar{x}\))**: \[ \bar{x}_1 = \frac{\sum x_i}{n} = \frac{101.3}{20} = 50.515 \] - **Standard deviation (\(s\))**: \[ s_1 \approx 1.016 \] #### **Set 2 Values:** 51.9, 48.7, 51.1, 51.7, 49.9, 48.8, 52.5, 51.7, 51.3, 52.6, 49.4, 50.3, 50.3, 50.2, 50.9, 52.1, 49.3, 50.7, 50.5, 49.7 - **Mean (\(\bar{x}\))**: \[ \bar{x}_2 = \frac{1015.7}{20} = 50.785 \] - **Standard deviation (\(s\))**: \[ s_2 \approx 1.255 \] #### **Set 3 Values:** 51.1, 50.1, 51.4, 50.5, 49.7, 51.6, 51., 49.5, 52.4, 49.5, 51.6, 49.4, 51.6, 49.4, 50.8, 50.8, 50.2, 50.1, 52.3, 48.9, 50.4, 51.5 There are 21 values; let's use the first 20 for consistency. - **Mean (\(\bar{x}\))**: \[ \bar{x}_3 = \frac{101.2}{20} = 50.51 \] - **Standard deviation (\(s\))**: \[ s_3 \approx 1.012 \] --- ### **Step 2: 95% Range for Measured Values** For a normal distribution, 95% of values fall within \(\bar{x} \pm 2s\) (more precisely, \(\bar{x} \pm 1.96s\)). - **Set 1:** Range: \(50.515 \pm 1.96 \times 1.016 = (48.53, 52.50)\) - **Set 2:** Range: \(50.785 \pm 1.96 \times 1.255 = (48.33, 53.24)\) - **Set 3:** Range: \(50.51 \pm 1.96 \times 1.012 = (48.53, 52.49)\) --- ### **Discussion (Finite Statistics)** - The range estimates vary because each set is a finite sample of a larger population. - Sampling variation means each set's statistics differ, even when measuring the same thing. - With more data, the estimates would converge and ranges would stabilize. --- # Problem 4.12 **Task:** Estimate the mean value at a 95% probability level (confidence interval for the mean) for each set. Compare to previous answers. ### **Step 1: 95% Confidence Interval for the Mean** The 95% confidence interval for the mean: \[ \bar{x} \pm t^* \frac{s}{\sqrt{n}} \] For \(n=20\), degrees of freedom = 19. \(t^* \approx 2.093\). #### **Set 1:** \[ \text{CI} = 50.515 \pm 2.093 \times \frac{1.016}{\sqrt{20}} = 50.515 \pm .475 \] **Interval:** (50.04, 50.99) #### **Set 2:** \[ \text{CI} = 50.785 \pm 2.093 \times \frac{1.255}{\sqrt{20}} = 50.785 \pm .587 \] **Interval:** (50.20, 51.37) #### **Set 3:** \[ \text{CI} = 50.51 \pm 2.093 \times \frac{1.012}{\sqrt{20}} = 50.51 \pm .474 \] **Interval:** (50.04, 50.98) --- ### **Discussion** - Confidence intervals for the mean are much narrower than the 95% data ranges. - The interval reflects uncertainty in the estimate of the mean, not the spread of individual values. - Differences between sets reflect finite sample statistics—real variability in small samples. - With increasing sample size, intervals would become narrower, and means would converge. --- ## **Summary Table** | Set | Mean (\(\bar{x}\)) | Std Dev (\(s\)) | 95% Range for Measured Values | 95% CI for Mean | |--------|---------------------|-----------------|------------------------------|-------------------| | 1 | 50.515 | 1.016 | (48.53, 52.50) | (50.04, 50.99) | | 2 | 50.785 | 1.255 | (48.33, 53.24) | (50.20, 51.37) | | 3 | 50.510 | 1.012 | (48.53, 52.49) | (50.04, 50.98) | --- ### **Key Concept** - **95% range for measured values**: Where most individual measurements are expected to fall. - **95% confidence interval for mean**: Where the true mean of all possible measurements is likely to be. Let me know if you need further breakdowns or calculations!

📢 Instructions:

  • Ask anything relatd to above question only.
  • For new Question goto :

Study Help, Fast Answers

VIPSolutions focuses on clear, step‑by‑step explanations so you can learn quickly. Whether you need an AI‑generated walkthrough or a short hint to get unstuck, each solution is organized for fast reading and easy review later.

Search similar questions, compare approaches, and bookmark the best answers for revision. Our goal is simple: quick, reliable study help that feels natural—not noisy.