 VIPSolutions
Give step-by-step solution with explanation and final answer:Use the graph of f to determine each of the following E (a) the domain of f = (b) the range of f 7 c) the zeros of f - y ih ) 10) i i WENA EREEES EE f ) the intervals on which f is increasing pe
Question:
Give step-by-step solution with explanation and final answer: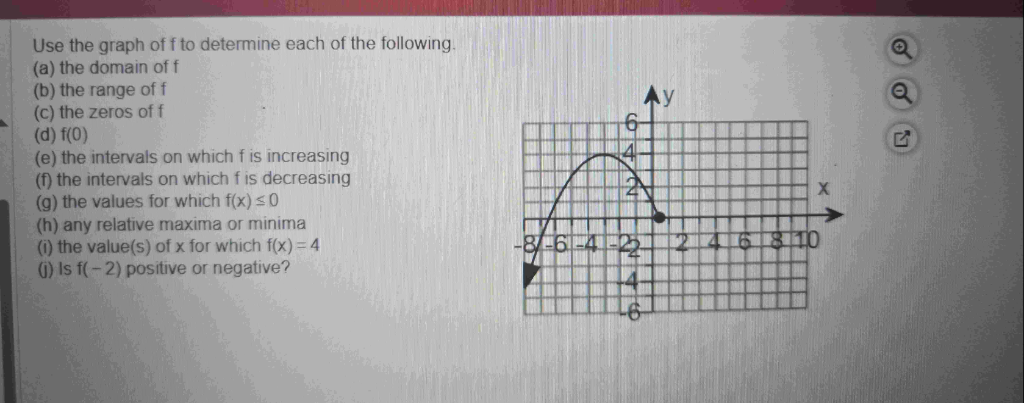 Use the graph of f to determine each of the following E
(a) the domain of f =
(b) the range of f 7
c) the zeros of f - y ih
) 10) i i WENA EREEES EE f
) the intervals on which f is increasing pe
This is AI generated Response.
Asked by: venky
Created at: 2025-09-24 05:50:48
Asked by: venky
Created at: 2025-09-24 05:50:48
Final Answer:
Rendered
Raw Text
Did you like this answer?
Let's analyze the graph step by step for each question:
---
## (a) **The domain of f**
- The domain is the set of all x-values for which the function is defined.
- From the graph, the curve starts at \( x = -8 \) and ends at \( x = 2 \) (closed dot at \( x = 2 \)), so:
- **Domain:** \(\boxed{[-8, 2]}\)
---
## (b) **The range of f**
- The range is the set of all y-values that the function takes.
- The lowest point on the graph is at \( y = -6 \) and the highest at \( y = 6 \):
- **Range:** \(\boxed{[-6, 6]}\)
---
## (c) **The zeros of f**
- Zeros are the x-values where \( f(x) = 0 \) (where the graph intersects the x-axis).
- From the graph, the function crosses the x-axis at \( x = -6 \) and \( x = 1 \):
- **Zeros:** \(\boxed{x = -6, 1}\)
---
## (d) **f(0)**
- The value of the function when \( x = 0 \).
- From the graph, at \( x = 0 \), \( y = 2 \):
- \(\boxed{f(0) = 2}\)
---
## (e) **The intervals on which f is increasing**
- The function is increasing where the graph goes up as you move from left to right.
- From \( x = -8 \) to \( x = -2 \), the graph increases:
- **Increasing on:** \(\boxed{[-8, -2]}\)
---
## (f) **The intervals on which f is decreasing**
- The function is decreasing where the graph goes down as you move from left to right.
- From \( x = -2 \) to \( x = 2 \), the graph decreases:
- **Decreasing on:** \(\boxed{[-2, 2]}\)
---
## (g) **The values for which \( f(x) \leq 0 \)**
- These are the x-values where the graph is on or below the x-axis.
- From the graph, \( f(x) \leq 0 \) for \( x \in [-8, -6] \cup [1, 2] \):
- \(\boxed{[-8, -6] \cup [1, 2]}\)
---
## (h) **Any relative maxima or minima**
- **Relative maximum:** The highest point in a local region.
- The maximum occurs at \( x = -2 \), where \( y = 6 \).
- **Relative minima:** The lowest point in a local region.
- There are no relative minima in the interior (the endpoints are not considered relative minima since the function doesn't "turn" there).
- **Relative maximum:** \(\boxed{( -2, 6 )}\)
- **Relative minimum:** \(\boxed{\text{None}}\)
---
## (i) **The value(s) of x for which \( f(x) = 4 \)**
- Where does the graph cross \( y = 4 \)?
- From the graph, \( f(x) = 4 \) at \( x = -4 \) and \( x = 0 \):
- \(\boxed{x = -4, 0}\)
---
## (j) **Is \( f(-2) \) positive or negative?**
- From the graph, at \( x = -2 \), \( y = 6 \) (which is positive).
- **Positive:** \(\boxed{\text{Positive}}\)
---
## **Summary Table**
| Part | Answer |
|------|---------------------------------------|
| a | \([-8, 2]\) |
| b | \([-6, 6]\) |
| c | \(x = -6, 1\) |
| d | 2 |
| e | \([-8, -2]\) |
| f | \([-2, 2]\) |
| g | \([-8, -6] \cup [1, 2]\) |
| h | Max: \((-2, 6)\); Min: None |
| i | \(x = -4, 0\) |
| j | Positive |
📢 Instructions:
- Ask anything relatd to above question only.
- For new Question goto :