Give step-by-step solution with explanation and final answer:anemots [05 | & | | KeeptheHighest05/3
3. The effect of negative externalities on the optimal quantity of consumption
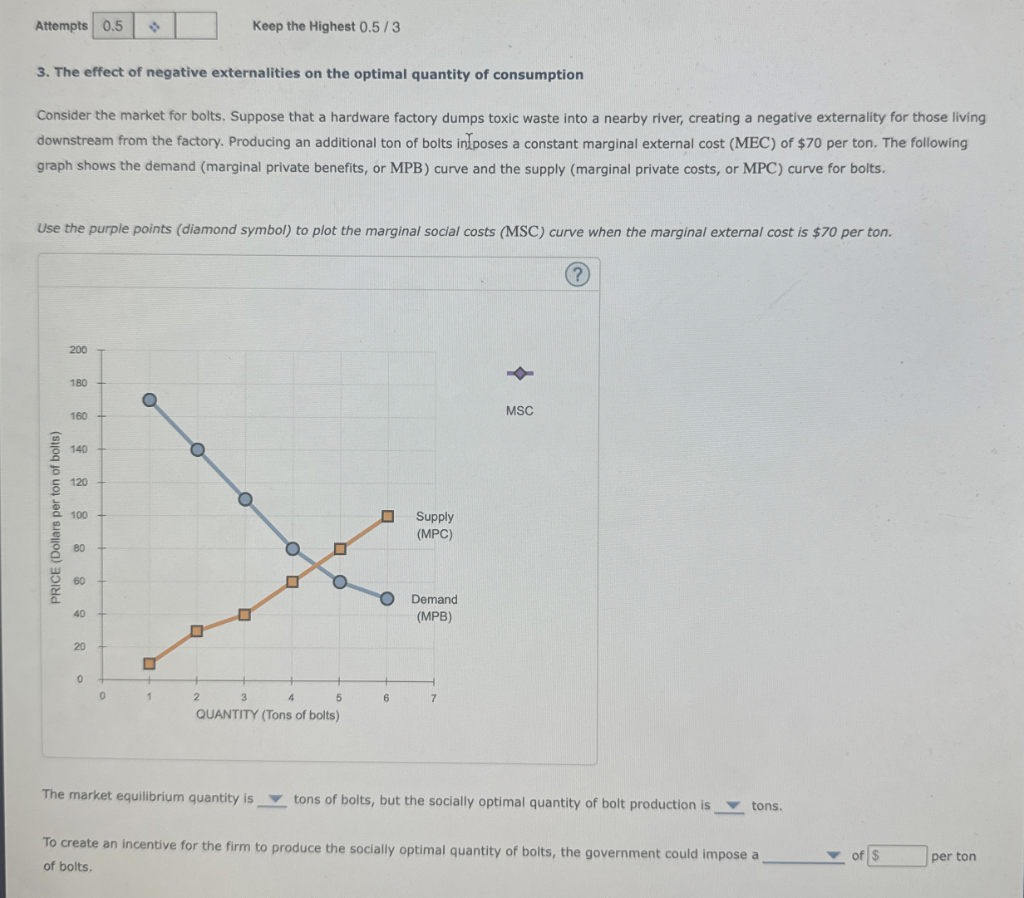
Consider the market for bolts. Suppose that a hardware factory dumps toxic waste into a nearby river, creating a negative externality for those living
downstream from the factory. Producing an additional ton of bolts infposes a constant marginal external cost (MEC) of $70 per ton. The following
graph shows the demand (marginal private benefits, or MPB) curve and the supply (marginal private costs, or MPC) curve for bolts.
Use the purple points (diamond symbol) to plot the marginal social costs (MSC) curve when the marginal external cost is $70 per ton.
=
©
™
msc
I)
=.
E 120
~
2 1m Supply
H pe)
0)
pr
8 wo
E Demand
4 (MPB)
»
o tt
Ec
QUANTITY (Tons of bolts)
The market equilibrium quantity is _w tons of bolts, but the socially optimal quantity of bolt production is _w tons.
To create an incentive for the firm to produce the socially optimal quantity of bolts, the government could impose a > ofS Jperton
| ofbots, |
Question:
Give step-by-step solution with explanation and final answer:
This is AI generated Response. Asked by: mayank Created at: 2025-09-15 19:32:16
Did you like this answer?
👍 0
👎 0
Let's solve the problem step by step:
---
## **Step 1: Understanding the Problem**
- **MPC (Marginal Private Cost)**: This is the supply curve (orange squares).
- **MPB (Marginal Private Benefit)**: This is the demand curve (blue circles).
- **MEC (Marginal External Cost)**: This is a constant $70 per ton.
- **MSC (Marginal Social Cost)**: This is MPC + MEC.
---
## **Step 2: Plotting the MSC Curve**
To get the MSC curve, **add $70 to each MPC value** at every quantity.
Let's extract the MPC (Supply) points from the graph:
- Q = 1: MPC = $20
- Q = 2: MPC = $40
- Q = 3: MPC = $60
- Q = 4: MPC = $80
- Q = 5: MPC = $100
- Q = 6: MPC = $120
Now, add $70 to each:
- Q = 1: MSC = $20 + $70 = $90
- Q = 2: MSC = $40 + $70 = $110
- Q = 3: MSC = $60 + $70 = $130
- Q = 4: MSC = $80 + $70 = $150
- Q = 5: MSC = $100 + $70 = $170
- Q = 6: MSC = $120 + $70 = $190
---
## **Step 3: Finding Market Equilibrium Quantity**
Market equilibrium is where MPC = MPB.
Look for the quantity where the orange square (MPC) and blue circle (MPB) intersect.
From the graph:
- At Q = 4: MPC = $80, MPB = $80
**Market equilibrium quantity is 4 tons.**
---
## **Step 4: Finding Socially Optimal Quantity**
Social optimum is where **MSC = MPB**.
From our earlier MSC values:
| Q | MSC | MPB |
|---|-----|-----|
| 1 | 90 | 180 |
| 2 | 110 | 140 |
| 3 | 130 | 100 |
| 4 | 150 | 80 |
| 5 | 170 | 60 |
| 6 | 190 | 40 |
Find where MSC = MPB.
At Q = 2: MSC = 110, MPB = 140
At Q = 3: MSC = 130, MPB = 100
So, the intersection is **between Q = 2 and Q = 3**. Let's interpolate:
Let \( Q^* \) be the optimal quantity.
\[
\text{MSC at } Q^* = \text{MPB at } Q^*
\]
MSC increases by 20 per unit, MPB decreases by 40 per unit between Q=2 and Q=3.
Let Q = 2 + x, where 0 < x < 1.
\[
MSC = 110 + 20x \\
MPB = 140 - 40x \\
\]
Set equal:
\[
110 + 20x = 140 - 40x \\
60x = 30 \\
x = 0.5 \\
\]
So, **Q = 2.5 tons** (socially optimal quantity).
---
## **Step 5: Government Policy**
To make firms internalize the externality, the government should impose a **tax equal to the external cost**, which is **$70 per ton**.
---
## **Step 6: Final Answers**
Fill in the blanks:
> The market equilibrium quantity is **4** tons of bolts, but the socially optimal quantity of bolt production is **2.5** tons.
>
> To create an incentive for the firm to produce the socially optimal quantity of bolts, the government could impose a **tax** of **$70** per ton of bolts.
---
## **Summary Table**
| Quantity (tons) | MPC | MSC (MPC+70) | MPB |
|-----------------|-----|--------------|-----|
| 1 | 20 | 90 | 180 |
| 2 | 40 | 110 | 140 |
| 3 | 60 | 130 | 100 |
| 4 | 80 | 150 | 80 |
| 5 | 100 | 170 | 60 |
| 6 | 120 | 190 | 40 |
---
## **Final Answers**
- Market equilibrium quantity: **4** tons
- Socially optimal quantity: **2.5** tons
- Government could impose a **tax** of **$70** per ton
---
Let me know if you need the plotted points for MSC or any other details!
📢 Instructions:
Ask anything relatd to above question only.
For new Question goto :
🚀 Submit (-0.25 Credits🪙)
Study Help, Fast Answers
VIPSolutions focuses on clear, step‑by‑step explanations so you can learn quickly. Whether you need an AI‑generated walkthrough or a short hint to get unstuck, each solution is organized for fast reading and easy review later.
Search similar questions, compare approaches, and bookmark the best answers for revision. Our goal is simple: quick, reliable study help that feels natural—not noisy.
 VIPSolutions
 anemots [05 | & | | KeeptheHighest05/3
3. The effect of negative externalities on the optimal quantity of consumption
Consider the market for bolts. Suppose that a hardware factory dumps toxic waste into a nearby river, creating a negative externality for those living
downstream from the factory. Producing an additional ton of bolts infposes a constant marginal external cost (MEC) of $70 per ton. The following
graph shows the demand (marginal private benefits, or MPB) curve and the supply (marginal private costs, or MPC) curve for bolts.
Use the purple points (diamond symbol) to plot the marginal social costs (MSC) curve when the marginal external cost is $70 per ton.
=
©
™
msc
I)
=.
E 120
~
2 1m Supply
H pe)
0)
pr
8 wo
E Demand
4 (MPB)
»
o tt
Ec
QUANTITY (Tons of bolts)
The market equilibrium quantity is _w tons of bolts, but the socially optimal quantity of bolt production is _w tons.
To create an incentive for the firm to produce the socially optimal quantity of bolts, the government could impose a > ofS Jperton
| ofbots, |