 VIPSolutions
Give step-by-step solution with explanation and final answer: The graph in the image represents a(n) A: Increase in supply B: Decrease in demand C: Decrease in supply D: Increase in demandPrice [e) fa) | g | Z 5 5
Question:
Give step-by-step solution with explanation and final answer:
The graph in the image represents a(n)
A: Increase in supply
B: Decrease in demand
C: Decrease in supply
D: Increase in demand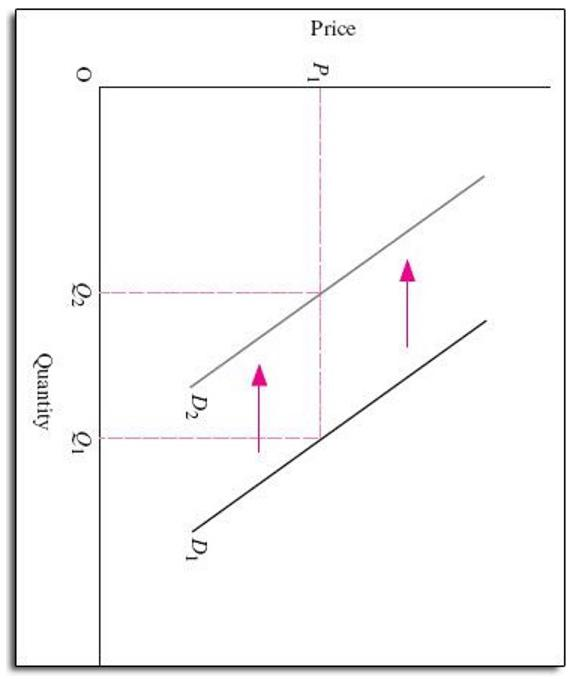 Price
[e) fa)
|
g |
Z 5
5
This is AI generated Response.
Asked by: mayank
Created at: 2025-09-07 16:13:28
Asked by: mayank
Created at: 2025-09-07 16:13:28
Final Answer:
Rendered
Raw Text
Did you like this answer?
Let's analyze the graph step by step:
### Step 1: Identify the Axes
- The vertical axis is labeled **Price**.
- The horizontal axis is labeled **Quantity**.
### Step 2: Identify the Curves
- There are two demand curves: **D₁** (original) and **D₂** (new).
- The arrows indicate a shift from **D₁** to **D₂**, meaning the entire demand curve has moved to the right.
### Step 3: Interpret the Shift
- A **rightward shift** of the demand curve means that at every price, the quantity demanded has **increased**.
### Step 4: Match the Shift to the Options
- **A: Increase in supply** – This would be a rightward shift of the supply curve, not shown here.
- **B: Decrease in demand** – This would be a leftward shift of the demand curve, not shown here.
- **C: Decrease in supply** – This would be a leftward shift of the supply curve, not shown here.
- **D: Increase in demand** – This matches a rightward shift of the demand curve as seen in the graph.
### Step 5: Final Answer
**The graph represents an:**
**D: Increase in demand**
---
**Explanation:**
The demand curve shifts to the right from D₁ to D₂, indicating at every price level more quantity is demanded. This is the definition of an "increase in demand."
📢 Instructions:
- Ask anything relatd to above question only.
- For new Question goto :