This is AI generated Response.
Asked by: Yatin
Created at: 2025-09-05 17:30:39
Final Answer:
RenderedRaw Text
Did you like this answer?
Let's break down your questions step by step according to the instructions:
---
## **1. Draw MSL Pressure Isobars Every 4 mb**
**Step-by-step:**
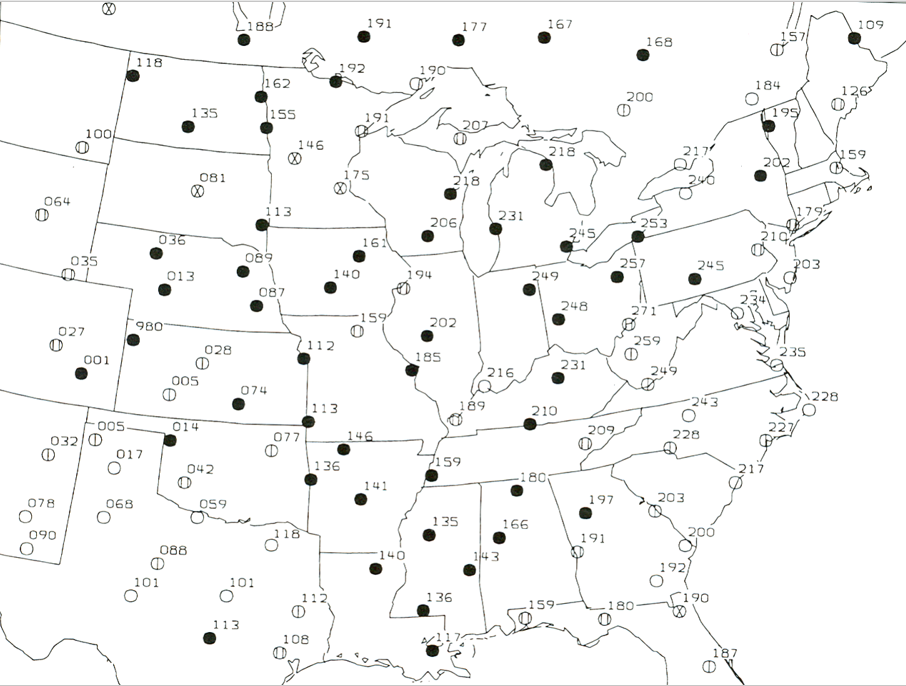
- **Identify Pressure Values:** The numbers plotted at each station are the MSL pressures in mb.
- **Choose Isobar Values:** Select a starting value, e.g., 1000 mb, and then draw isobars at intervals of 4 mb (e.g., 996, 1000, 1004, 1008, 1012, etc.).
- **Draw Isobars:** Connect points of equal pressure smoothly. Isobars should not cross each other.
- **Sketch Example:**
- If you see 245 at one station and 241 at a nearby station, the 244 mb isobar passes between them.
*(Since I can't physically draw on your image, you would print or use a digital tool to connect these pressure values with lines.)*
---
## **2. Sketch Geostrophic and Surface Wind Directions**
**Geostrophic Wind:**
- **Direction:** Parallel to isobars, with low pressure on the left (in the Northern Hemisphere).
- **Indicate with:** Blue arrows.
**Surface Wind:**
- **Direction:** Crosses isobars at a slight angle toward lower pressure due to friction, typically 20-30° from the isobar direction toward low pressure.
- **Indicate with:** Green arrows.
**Where to Draw:**
- Pick several locations on the map, especially near tightly packed isobars, and sketch blue arrows parallel to isobars, green arrows at a slight angle toward lower pressure.
---
## **3. Compute Geostrophic Wind Speed at 45ºN (Isobars 250 km Apart)**
**Formula:**
\[
V_g = \frac{1}{f \rho} \left| \frac{\Delta p}{\Delta n} \right|
\]
But commonly:
\[
V_g = \frac{g}{f} \cdot \frac{\Delta Z}{\Delta n}
\]
For surface maps (pressure):
\[
V_g = \frac{1}{f \rho} \cdot \frac{\Delta p}{\Delta n}
\]
**Simplified for pressure:**
\[
V_g \approx \frac{\Delta p}{f \rho \Delta n}
\]
Where:
- \(\Delta p\) = pressure difference (4 mb = 400 Pa)
- \(\Delta n\) = distance between isobars (250 km = 250,000 m)
- \(\rho\) = air density (1.225 kg/m³)
- \(f\) = Coriolis parameter \( = 2\Omega \sin \phi \) (\(\Omega = 7.292 \times 10^{-5}\) s⁻¹)
**At \(45^\circ N\):**
- \(\sin 45^\circ = 0.7071\)
- \(f = 2 \times 7.292 \times 10^{-5} \times 0.7071 \approx 1.03 \times 10^{-4}\) s⁻¹
**Plug in values:**
\[
V_g = \frac{400}{1.03 \times 10^{-4} \times 1.225 \times 250,000}
\]
Calculate denominator:
\[
1.03 \times 10^{-4} \times 1.225 \times 250,000 = 31.56
\]
Calculate \(V_g\):
\[
V_g = \frac{400}{31.56} \approx 12.7 \text{ m/s}
\]
---
## **4. Compute Geostrophic Wind Speed at 30ºN (Same Isobar Spacing)**
**At \(30^\circ N\):**
- \(\sin 30^\circ = 0.5\)
- \(f = 2 \times 7.292 \times 10^{-5} \times 0.5 = 7.292 \times 10^{-5}\) s⁻¹
**Plug in values:**
\[
V_g = \frac{400}{7.292 \times 10^{-5} \times 1.225 \times 250,000}
\]
Calculate denominator:
\[
7.292 \times 10^{-5} \times 1.225 \times 250,000 = 22.35
\]
Calculate \(V_g\):
\[
V_g = \frac{400}{22.35} \approx 17.9 \text{ m/s}
\]
---
## **Summary Table**
| Latitude | Coriolis \(f\) (s⁻¹) | Wind Speed (m/s) |
|----------|----------------------|------------------|
| 45ºN | \(1.03 \times 10^{-4}\) | 12.7 |
| 30ºN | \(7.29 \times 10^{-5}\) | 17.9 |
---
## **Final Answers:**
1. **Draw isobars every 4 mb on the map by connecting stations of equal pressure.**
2. **Draw blue arrows parallel to isobars (geostrophic wind), green arrows at a slight angle across isobars toward lower pressure (surface wind).**
3. **Geostrophic wind speed at 45ºN with 4 mb isobars 250 km apart: ≈ 12.7 m/s**
4. **Geostrophic wind speed at 30ºN with same spacing: ≈ 17.9 m/s**
If you need a visual sketch or want to see arrows drawn on the map, let me know and I can annotate the image for you!
VIPSolutions focuses on clear, step‑by‑step explanations so you can learn quickly. Whether you need an AI‑generated walkthrough or a short hint to get unstuck, each solution is organized for fast reading and easy review later.
Search similar questions, compare approaches, and bookmark the best answers for revision. Our goal is simple: quick, reliable study help that feels natural—not noisy.
 VIPSolutions
 ® oo
Noa) 151 ir Nos
108 o vg Au
16
— [J ° P 8 a _
192 190
h62 TN, 184 \
2 200 I$ a3
3 [9
100) Ld 3 FO
[) 146 21 2177
® 21, & AS 59
081 17s Ya Bh
- ® | @L . Je
{13 17
o 206 231 ' 253 {F
0 cl ® 45 31g;
035 hd 083 ° 257 2s © hos
SEY wo os we 5
° EC 7 oe 7
° 28 oY,
560 159) 207 .
027 o ° 259
© ox = he 5 -
s 331
[ ] 005 216 ° 249
lo) 074 ; $1228
Ld 1:3 g4Y ge ol pe]
227
032] Te" S77 37 228 =
[9) on o * 159
o 042 136 co 217
o 141 ° @
078 068 0s9 LJ Pa 203 Va
[e] o 135 166
090 11 ° ° 191 200
o 088 Sl 140 143
J ° ° 192)
got go o
13 136 190
o sooo
Po 4
108 11 7-=C
of J... ou) Yaz
\ PE SPA AS