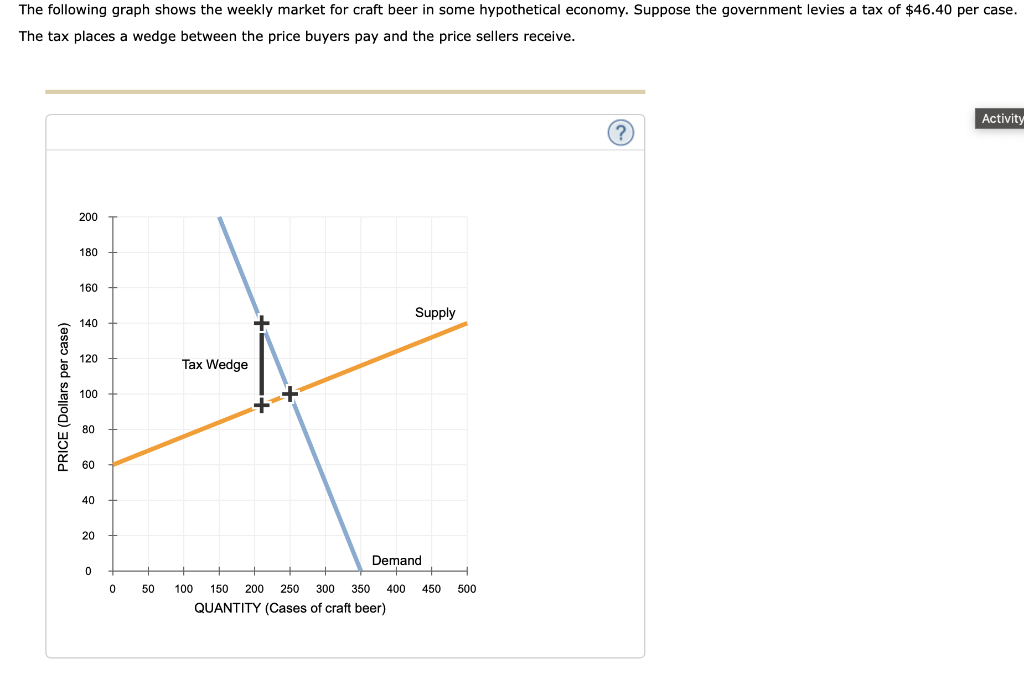
Give step-by-step solution with explanation and final answer:The following graph shows the weekly market for craft beer in some hypothetical economy. Suppose the government levies a tax of $46.40 per case.
The tax places a wedge between the price buyers pay and the price sellers receive.
®
200
180
160
Supp
oo + upply
§
gm Tax Wedge
2
§ wo +t
[=
oe
2]
gw
0
20
Demand
0
0 50 100 150 200 250 00 350 400 450 500
QUANTITY (Cases of craft beer)
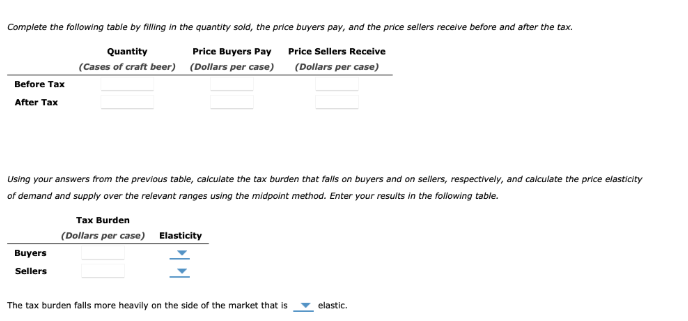
Complete the folowing table by ing nthe quant 5, th pric buyers py, and the pice seers receive before and afer he tax:
quantity Price Buyers Pay Price Sellers Receive
(Cases of craft beer) (Dollars per case) _ (Doors per case)
Aer Tax
ig your answers fom the previous tae, aka the ax burden tat fl a buyers an on slr, respectively, and calculate the pce lst
of demand and sup over the relevant ranges using the midpoint meth. Ener your resus the folloig able.
(Dollars per case) _Etasticty
Byers =
he tox burden ols mor heey on th ide of th market hats cls
Question:
Give step-by-step solution with explanation and final answer:The following graph shows the weekly market for craft beer in some hypothetical economy. Suppose the government levies a tax of $46.40 per case.
The tax places a wedge between the price buyers pay and the price sellers receive.
®
200
180
160
Supp
oo + upply
§
gm Tax Wedge
2
§ wo +t
[=
oe
2]
gw
0
20
Demand
0
0 50 100 150 200 250 00 350 400 450 500
QUANTITY (Cases of craft beer)
Complete the folowing table by ing nthe quant 5, th pric buyers py, and the pice seers receive before and afer he tax:
quantity Price Buyers Pay Price Sellers Receive
(Cases of craft beer) (Dollars per case) _ (Doors per case)
Aer Tax
ig your answers fom the previous tae, aka the ax burden tat fl a buyers an on slr, respectively, and calculate the pce lst
of demand and sup over the relevant ranges using the midpoint meth. Ener your resus the folloig able.
(Dollars per case) _Etasticty
Byers =
he tox burden ols mor heey on th ide of th market hats cls
This is AI generated Response.
Asked by: mayank
Created at: 2025-08-29 18:45:59
Final Answer:
RenderedRaw Text
Did you like this answer?
Let's break down the problem step by step:
### Step 1: Read Values from the Graph
#### **Before Tax (Equilibrium)**
- **Equilibrium Quantity:** Find where supply and demand cross. From the graph, this is at **250 cases**.
- **Equilibrium Price:** At this quantity, the price is **$100 per case**.
#### **After Tax**
- The tax creates a “wedge” between the price buyers pay and what sellers receive. The vertical distance between the supply and demand curves at the new quantity reflects the tax amount ($46.40).
- **Buyers’ Price (after tax):** The top intersection of the tax wedge on the demand curve is **$123.20**.
- **Sellers’ Price (after tax):** The bottom intersection of the tax wedge on the supply curve is **$76.80**.
- **Quantity (after tax):** The new equilibrium after the tax is **200 cases** (vertical line through the tax wedge).
---
### Step 2: Fill in the Table
| | Quantity (Cases) | Price Buyers Pay ($) | Price Sellers Receive ($) |
|-----------------------|------------------|----------------------|---------------------------|
| **Before Tax** | 250 | 100 | 100 |
| **After Tax** | 200 | 123.20 | 76.80 |
---
### Step 3: Calculate Tax Burden on Buyers and Sellers
- **Tax per case:** $46.40
- **Buyers' Burden:** Price buyers pay after tax - price before tax = $123.20 - $100 = **$23.20**
- **Sellers' Burden:** Price before tax - price sellers receive after tax = $100 - $76.80 = **$23.20**
---
### Step 4: Calculate Elasticities Using the Midpoint Method
#### **Elasticity of Demand**
\[
\text{Elasticity of Demand} = \frac{(\Delta Q / \text{Average Q})}{(\Delta P / \text{Average P})}
\]
\[
\Delta Q = 200 - 250 = -50, \text{ Average Q} = \frac{250+200}{2} = 225
\]
\[
\Delta P = 123.20 - 100 = 23.20, \text{ Average P} = \frac{100+123.20}{2} = 111.60
\]
\[
\text{Elasticity of Demand} = \frac{(-50/225)}{(23.20/111.60)} = \frac{-0.222}{0.208} \approx -1.07
\]
#### **Elasticity of Supply**
\[
\Delta Q = 200 - 250 = -50, \text{ Average Q} = 225
\]
\[
\Delta P = 100 - 76.80 = 23.20, \text{ Average P} = \frac{100+76.80}{2} = 88.40
\]
\[
\text{Elasticity of Supply} = \frac{(-50/225)}{(-23.20/88.40)} = \frac{-0.222}{-0.262} \approx 0.85
\]
---
### Step 5: Fill in the Second Table
| Tax Burden (per case) | Elasticity |
|-----------------------|-----------------|
| Buyers: $23.20 | 1.07 |
| Sellers: $23.20 | 0.85 |
---
### Step 6: Interpret the Tax Burden
- The tax burden falls more heavily on the side of the market that is **less elastic**.
- **Elasticity of supply (0.85)** < **elasticity of demand (1.07)**, so the **sellers** bear more of the tax burden.
---
## **Summary Table Answers**
**Table 1:**
| | Quantity | Price Buyers Pay | Price Sellers Receive |
|-----------------------|----------|------------------|----------------------|
| **Before Tax** | 250 | 100 | 100 |
| **After Tax** | 200 | 123.20 | 76.80 |
**Table 2:**
| | Tax Burden | Elasticity |
|--------|------------|------------|
| Buyers | $23.20 | 1.07 |
| Sellers| $23.20 | 0.85 |
**Conclusion:**
The tax burden falls more heavily on the side of the market that is **less elastic** (sellers).
---
**If you have further questions or need calculation details, let me know!**
VIPSolutions focuses on clear, step‑by‑step explanations so you can learn quickly. Whether you need an AI‑generated walkthrough or a short hint to get unstuck, each solution is organized for fast reading and easy review later.
Search similar questions, compare approaches, and bookmark the best answers for revision. Our goal is simple: quick, reliable study help that feels natural—not noisy.
 VIPSolutions
 The following graph shows the weekly market for craft beer in some hypothetical economy. Suppose the government levies a tax of $46.40 per case.
The tax places a wedge between the price buyers pay and the price sellers receive.
®
200
180
160
Supp
oo + upply
§
gm Tax Wedge
2
§ wo +t
[=
oe
2]
gw
0
20
Demand
0
0 50 100 150 200 250 00 350 400 450 500
QUANTITY (Cases of craft beer)
Complete the folowing table by ing nthe quant 5, th pric buyers py, and the pice seers receive before and afer he tax:
quantity Price Buyers Pay Price Sellers Receive
(Cases of craft beer) (Dollars per case) _ (Doors per case)
Aer Tax
ig your answers fom the previous tae, aka the ax burden tat fl a buyers an on slr, respectively, and calculate the pce lst
of demand and sup over the relevant ranges using the midpoint meth. Ener your resus the folloig able.
(Dollars per case) _Etasticty
Byers =
he tox burden ols mor heey on th ide of th market hats cls