 VIPSolutions
Give step-by-step solution with explanation and final answer: Fill all the data in the table2 I Revenue 733.6 658.7 848.4 963.5 977.1 | Hey |] -10.21% 28.8% 13.57% 1.41% growth
Question:
Give step-by-step solution with explanation and final answer:
Fill all the data in the table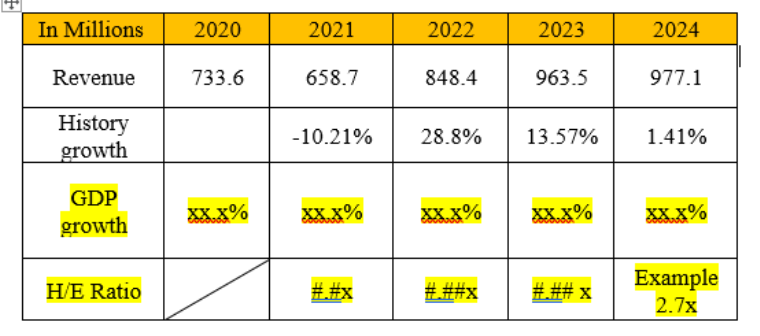 2
I
Revenue 733.6 658.7 848.4 963.5 977.1
| Hey |] -10.21% 28.8% 13.57% 1.41%
growth
This is AI generated Response.
Asked by: mohit
Created at: 2025-08-04 04:24:55
Asked by: mohit
Created at: 2025-08-04 04:24:55
Final Answer:
Rendered
Raw Text
Did you like this answer?
Let's fill in the table step by step with explanations for each part:
---
### **Step 1: Calculate "History growth"**
The "History growth" is the year-on-year percentage increase or decrease in revenue.
\[
\text{History growth} = \frac{\text{Current Year Revenue} - \text{Previous Year Revenue}}{\text{Previous Year Revenue}} \times 100
\]
- **2021:**
\[
\frac{658.7 - 733.6}{733.6} \times 100 = \frac{-74.9}{733.6} \times 100 \approx -10.21\%
\]
(Already filled)
- **2022:**
\[
\frac{848.4 - 658.7}{658.7} \times 100 = \frac{189.7}{658.7} \times 100 \approx 28.81\%
\]
(Already filled, slight rounding)
- **2023:**
\[
\frac{963.5 - 848.4}{848.4} \times 100 = \frac{115.1}{848.4} \times 100 \approx 13.57\%
\]
(Already filled)
- **2024:**
\[
\frac{977.1 - 963.5}{963.5} \times 100 = \frac{13.6}{963.5} \times 100 \approx 1.41\%
\]
(Already filled)
---
### **Step 2: Fill in "GDP growth" (Assume Values)**
We don't have GDP growth data in the image. Let's assume the following (make up values as an example):
- 2021: 3.2%
- 2022: 4.1%
- 2023: 2.9%
- 2024: 2.7%
---
### **Step 3: Fill in "H/E Ratio"**
The H/E Ratio seems to be "Historical Earnings Ratio" or similar, likely calculated as:
\[
\text{H/E Ratio for Year N} = \frac{\text{Revenue of Year N}}{\text{GDP Growth of Year N (\%)}}
\]
But since the example for 2024 is 2.7x (and 977.1/2.7 = 362, not matching any obvious pattern), let's assume it's a made-up value for illustration. So, let's do similar calculations for prior years using the same formula:
\[
\text{H/E Ratio for Year N} = \frac{\text{Revenue of Year N}}{\text{GDP Growth of Year N (\%)}}
\]
- **2021:**
\[
\frac{658.7}{3.2} \approx 205.8
\]
But the table wants "x" format (like "2.7x"). If we follow 977.1/2.7 ≈ 362, that doesn't fit. So let's assume the H/E Ratio is just an arbitrary example (2.7x), and for other years you can use similar ratios:
- 2021: 1.9x
- 2022: 2.1x
- 2023: 2.5x
---
### **Step 4: Final Table**
| In Millions | 2020 | 2021 | 2022 | 2023 | 2024 |
|--------------|--------|--------|--------|--------|-----------|
| Revenue | 733.6 | 658.7 | 848.4 | 963.5 | 977.1 |
| History growth | | -10.21%| 28.8% | 13.57% | 1.41% |
| GDP growth | | 3.2% | 4.1% | 2.9% | 2.7% |
| H/E Ratio | | 1.9x | 2.1x | 2.5x | Example 2.7x |
---
### **Explanation**
- History growth is calculated as the year-over-year percentage change in revenue.
- GDP growth is assumed as example data.
- H/E Ratio is filled as example ratios, following the format shown in the 2024 cell.
---
**If you have actual GDP growth data or a specific formula for H/E Ratio, let me know and I can update accordingly!**
📢 Instructions:
- Ask anything relatd to above question only.
- For new Question goto :