 VIPSolutions
Give step-by-step solution with explanation and final answer:dence interval conStUEEERTETET 57 Suppose (FX) satisfy the 16050 squares assumptions in KY Concept 4 dom sample of size = 25015 drawn and yields §=54 4220. R= 026, SER = 62. G1 09) a. Tost Hy: py = Ove HBr 7 0 at the 5% level b. Construct 95% confidence jnterval for Suppose you eared that ¥iand were independent. Would YO! be surprised? Explain: aaa Bercises 203 4. Suppose ¥; and X; are independes and X, are independent and many sam aan = drawn, regressions. Ei and iS ae samples of size n = 250 are 1] oe py = 0 ve ocudod es ? In what faction of samples in the confidence interval from (0)? ema EE
Question:
Give step-by-step solution with explanation and final answer: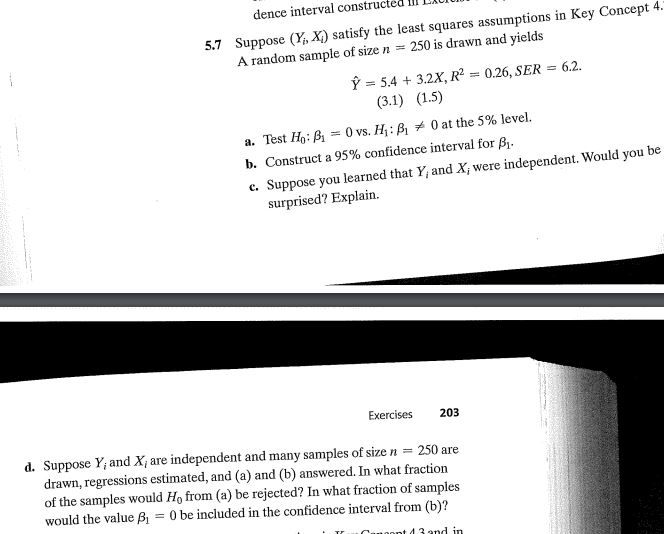 dence interval conStUEEERTETET
57 Suppose (FX) satisfy the 16050 squares assumptions in KY Concept 4
dom sample of size = 25015 drawn and yields
§=54 4220. R= 026, SER = 62.
G1 09)
a. Tost Hy: py = Ove HBr 7 0 at the 5% level
b. Construct 95% confidence jnterval for
Suppose you eared that ¥iand were independent. Would YO! be
surprised? Explain:
aaa
Bercises 203
4. Suppose ¥; and X; are independes
and X, are independent and many sam aan =
drawn, regressions. Ei and iS ae samples of size n = 250 are 1]
oe py = 0 ve ocudod es ? In what faction of samples
in the confidence interval from (0)?
ema EE
This is AI generated Response.
Asked by: Umesh
Created at: 2025-07-27 23:46:32
Asked by: Umesh
Created at: 2025-07-27 23:46:32
Final Answer:
Rendered
Raw Text
Did you like this answer?
Let's work through each part step-by-step using the information given:
### Given Regression Output
\[
\hat{Y} = 5.4 + 3.2 X, \quad R^2 = 0.26, \quad SER = 6.2
\]
Standard errors (in parentheses) for the intercept and slope:
- Intercept: 5.4 (**SE = 3.1**)
- Slope: 3.2 (**SE = 1.5**)
Sample size: \( n = 250 \)
---
## **a. Test \( H_0: \beta_1 = 0 \) vs. \( H_1: \beta_1 \neq 0 \) at the 5% level**
**Step 1: State the hypotheses**
- Null: \( H_0: \beta_1 = 0 \)
- Alternative: \( H_1: \beta_1 \neq 0 \)
**Step 2: Compute the t-statistic**
\[
t = \frac{\hat{\beta}_1 - 0}{SE(\hat{\beta}_1)} = \frac{3.2 - 0}{1.5} = 2.13
\]
**Step 3: Find the critical value**
- For large \( n \), use the standard normal critical value for a two-sided test at 5%: \( z_{0.025} \approx 1.96 \)
**Step 4: Compare**
- \( |t| = 2.13 > 1.96 \)
- **Reject \( H_0 \) at the 5% level.**
---
## **b. Construct a 95% confidence interval for \( \beta_1 \)**
\[
\text{CI} = \hat{\beta}_1 \pm z_{0.025} \times SE(\hat{\beta}_1)
\]
\[
= 3.2 \pm 1.96 \times 1.5
\]
\[
= 3.2 \pm 2.94
\]
\[
= [3.2 - 2.94, 3.2 + 2.94] = [0.26, 6.14]
\]
**Final 95% CI:**
\[
\boxed{[0.26,\ 6.14]}
\]
---
## **c. Suppose you learned that \( Y_i \) and \( X_i \) were independent. Would you be surprised? Explain.**
**Explanation:**
- If \( Y_i \) and \( X_i \) are independent, the true \( \beta_1 = 0 \).
- In part (a), we rejected \( H_0 \) and in (b), the 95% CI does **not** include 0; both indicate a statistically significant relationship.
- **Therefore, yes, you should be surprised** if \( Y_i \) and \( X_i \) are actually independent but your regression suggests otherwise. This could be due to random sampling variation or a violation of regression assumptions.
---
## **d. Suppose \( Y_i \) and \( X_i \) are independent and many samples of size \( n = 250 \) are drawn, regressions estimated, and (a) and (b) answered. In what fraction of the samples would \( H_0 \) from (a) be rejected? In what fraction of samples would \( \beta_1 = 0 \) be included in the confidence interval from (b)?**
**Explanation:**
- If \( Y_i \) and \( X_i \) are truly independent, the true \(\beta_1 = 0\).
- The test from (a) is a 5% level test, so you'd expect to **reject \( H_0 \) in about 5% of samples** (Type I error rate).
- The 95% CI from (b) should contain the true value (\(0\)) in **about 95% of samples** by construction.
---
### **Summary of Answers**
**a.** Test statistic is 2.13; reject \( H_0 \) at 5% level.
**b.** 95% CI is \(\boxed{[0.26,\ 6.14]}\)
**c.** Yes, you would be surprised since independence implies \(\beta_1 = 0\), but regression suggests otherwise.
**d.** About 5% of samples would reject \( H_0 \); about 95% of samples' 95% CIs would include \( \beta_1 = 0 \).
Let me know if you need any step in more detail!
📢 Instructions:
- Ask anything relatd to above question only.
- For new Question goto :