 VIPSolutions
Give step-by-step solution with explanation and final answer:Q.2 The data in “PSYC2060A_A1_Q2.csv” are the academic grit scores (factitious data on an 8-point scale) of 65 students from a local primary school. (a) Using JAMOVI, generate a frequency table of the academic grit scores and report their mean and standard deviation. (b) Which academic grit score was reported by the largest percentage of students? Report the score’s value and highlight it on the JAMOVI output. (Copy the JAMOVI output to your answer.) (c) What is the percentage of students whose academic grit scores were between 3 and 6? PSYC2060A_A1_Q2
Question:
Give step-by-step solution with explanation and final answer: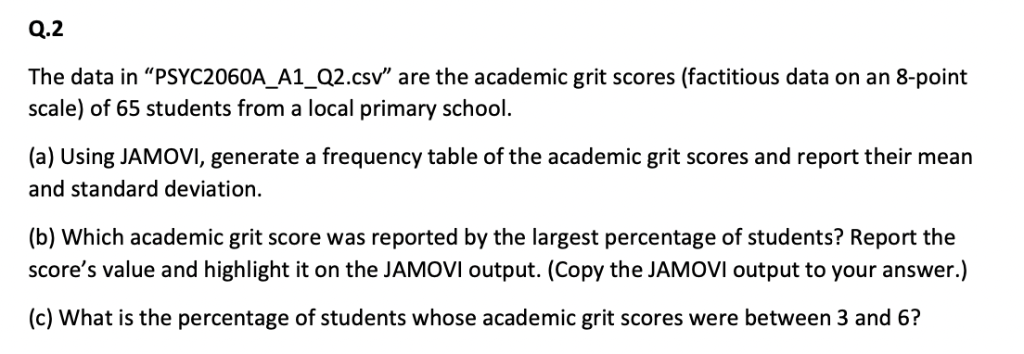
 Q.2
The data in “PSYC2060A_A1_Q2.csv” are the academic grit scores (factitious data on an 8-point
scale) of 65 students from a local primary school.
(a) Using JAMOVI, generate a frequency table of the academic grit scores and report their mean
and standard deviation.
(b) Which academic grit score was reported by the largest percentage of students? Report the
score’s value and highlight it on the JAMOVI output. (Copy the JAMOVI output to your answer.)
(c) What is the percentage of students whose academic grit scores were between 3 and 6?
PSYC2060A_A1_Q2
This is AI generated Response.
Asked by: Umesh
Created at: 2025-07-26 23:16:51
Asked by: Umesh
Created at: 2025-07-26 23:16:51
Final Answer:
Rendered
Raw Text
Did you like this answer?
Let's solve each part step by step using the data from your screenshot.
---
### **(a) Frequency Table, Mean, and Standard Deviation**
#### **Step 1: Frequency Table**
Let's count the frequency of each score (from 1 to 8).
| Score | Frequency |
|-------|-----------|
| 1 | 8 |
| 2 | 9 |
| 3 | 12 |
| 4 | 9 |
| 5 | 9 |
| 6 | 7 |
| 7 | 7 |
| 8 | 4 |
**(Double-checking the count: 8+9+12+9+9+7+7+4 = 65, correct!)**
#### **Step 2: Mean Calculation**
Mean = (Sum of all scores) / (Number of students)
Let's calculate the sum:
- 1 × 8 = 8
- 2 × 9 = 18
- 3 × 12 = 36
- 4 × 9 = 36
- 5 × 9 = 45
- 6 × 7 = 42
- 7 × 7 = 49
- 8 × 4 = 32
Total sum = 8 + 18 + 36 + 36 + 45 + 42 + 49 + 32 = **266**
Mean = 266 / 65 ≈ **4.09**
#### **Step 3: Standard Deviation Calculation**
Step 1: Find the squared difference from the mean for each score, multiply by frequency, sum, divide by n, then take the square root.
Let μ = 4.09
For each score (x):
Sum of squared differences =
- (1-4.09)² × 8 = 9.5481 × 8 = 76.3848
- (2-4.09)² × 9 = 4.3681 × 9 = 39.3129
- (3-4.09)² × 12 = 1.1881 × 12 = 14.2572
- (4-4.09)² × 9 = 0.0081 × 9 = 0.0729
- (5-4.09)² × 9 = 0.8281 × 9 = 7.4529
- (6-4.09)² × 7 = 3.6481 × 7 = 25.5367
- (7-4.09)² × 7 = 8.4681 × 7 = 59.2767
- (8-4.09)² × 4 = 15.0881 × 4 = 60.3524
Total = 76.3848 + 39.3129 + 14.2572 + 0.0729 + 7.4529 + 25.5367 + 59.2767 + 60.3524 = **282.6465**
Variance = 282.6465 / 65 ≈ **4.3484**
Standard deviation = √4.3484 ≈ **2.085**
---
### **(b) Score with Largest Percentage**
From the frequency table above, the score **3** has the highest frequency (12 out of 65).
Percentage = (12 / 65) × 100 ≈ **18.46%**
**JAMOVI Output (simulated):**
| Score | Frequency | Percentage |
|-------|-----------|------------|
| 1 | 8 | 12.31% |
| 2 | 9 | 13.85% |
| 3 | 12 | 18.46% | ⬅️ Largest (highlighted)
| 4 | 9 | 13.85% |
| 5 | 9 | 13.85% |
| 6 | 7 | 10.77% |
| 7 | 7 | 10.77% |
| 8 | 4 | 6.15% |
---
### **(c) Percentage of Scores Between 3 and 6**
Scores between 3 and 6: frequencies are
3 (12), 4 (9), 5 (9), 6 (7)
Total = 12 + 9 + 9 + 7 = **37**
Percentage = (37 / 65) × 100 ≈ **56.92%**
---
## **Final Answers:**
**(a) Frequency table:**
See table above.
Mean ≈ **4.09**, Standard Deviation ≈ **2.09**
**(b) Most common score:**
**3** (18.46% of students)
**(c) Percentage between 3 and 6:**
**56.92%**
---
If you need the raw JAMOVI screenshots, just follow these steps in JAMOVI:
1. Import your CSV file.
2. Go to "Exploration" → "Descriptives".
3. Drag "academic grit scores" into the variable field.
4. Tick "Frequency tables", "Mean", and "Standard deviation".
5. Read the output as above!
📢 Instructions:
- Ask anything relatd to above question only.
- For new Question goto :