 VIPSolutions
Give step-by-step solution with explanation and final answer:a -13 : AEE i’ An important aspect of customer service and satisfaction at the Big Country theme park is the maintenance of the washrooms 3 throughout the park. Customers expect the washrooms to be clean; odorless; well-stocked with soap, paper towels, and toilet Sct of paper and to have a comfortable temperature. To maintain quality, park quality-control inspectors randomly inspect washrooms daily (during the day and evening) and record the number of defects (incidences of poof maintenance). The goal of park Lr management is approximately 10 defects per inspection period. The Excel workbook posted to Moodle contains a summary of the observations taken by these inspectors for 20 consecutive inspection periods. Construct the appropriate control chart for this maintenance process using 30 limits. | 7 Sample Number of Defects 1 7 2 14 3 6 4 9 & 12 6 3 ( 7 1 8 7 9 i 10 8 n ies 12 10 13 1 pe) ih 15 9 16 13 17 7 18 15 19 11 20 16. if «What is the 30 upper cantrol limit for this data? (Round to 2 decimal places) Ee ee as ai eo SE —ee
Question:
Give step-by-step solution with explanation and final answer: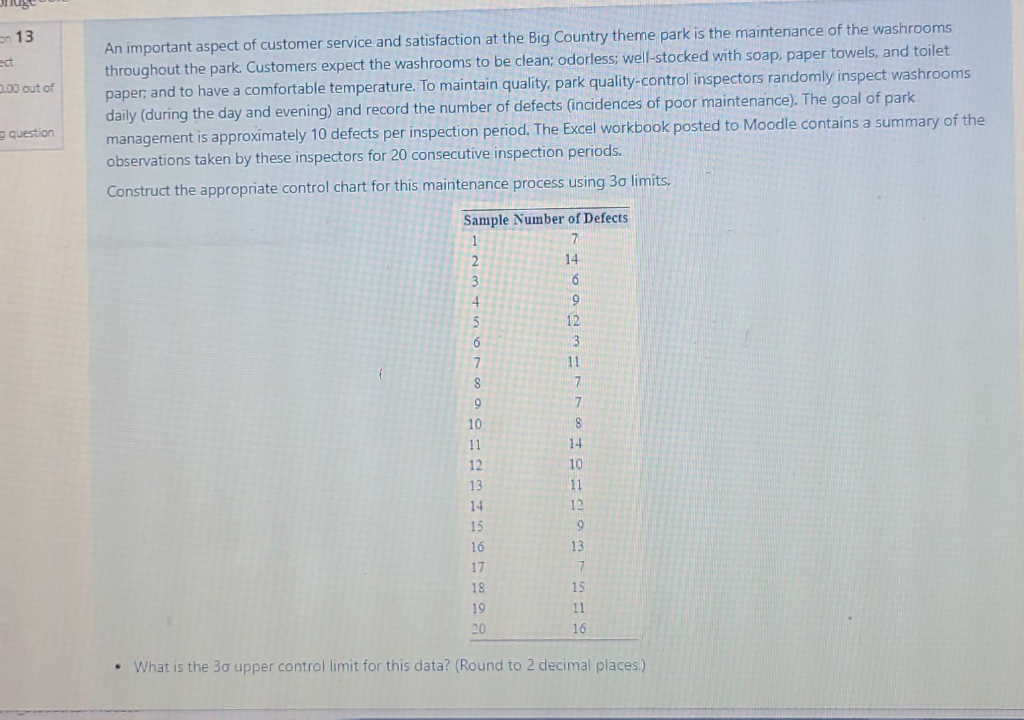 a
-13 : AEE i’
An important aspect of customer service and satisfaction at the Big Country theme park is the maintenance of the washrooms
3 throughout the park. Customers expect the washrooms to be clean; odorless; well-stocked with soap, paper towels, and toilet
Sct of paper and to have a comfortable temperature. To maintain quality, park quality-control inspectors randomly inspect washrooms
daily (during the day and evening) and record the number of defects (incidences of poof maintenance). The goal of park
Lr management is approximately 10 defects per inspection period. The Excel workbook posted to Moodle contains a summary of the
observations taken by these inspectors for 20 consecutive inspection periods.
Construct the appropriate control chart for this maintenance process using 30 limits. | 7
Sample Number of Defects
1 7
2 14
3 6
4 9
& 12
6 3
( 7 1
8 7
9 i
10 8
n ies
12 10
13 1
pe) ih
15 9
16 13
17 7
18 15
19 11
20 16. if
«What is the 30 upper cantrol limit for this data? (Round to 2 decimal places)
Ee ee as ai eo SE —ee
Asked by: gvr
Created at: 2025-07-25 15:38:16
Final Answer:
📢 Instructions:
- Ask anything relatd to above question only.
- For new Question goto :