 VIPSolutions
Give step-by-step solution with explanation and final answer:{Bq pede y ye to te | gh when pind LE 1 or c Tomer jo obi “2 L-4. a - ' My Pe | Wkly | Av: = 0,25 “0, 0.53 by ve A v= L.o> q v To # 9 IN I oe) = k- | i ] | " | 15 : = fe, 157 oll, oad He We ok Aprph on LEE,
Question:
Give step-by-step solution with explanation and final answer: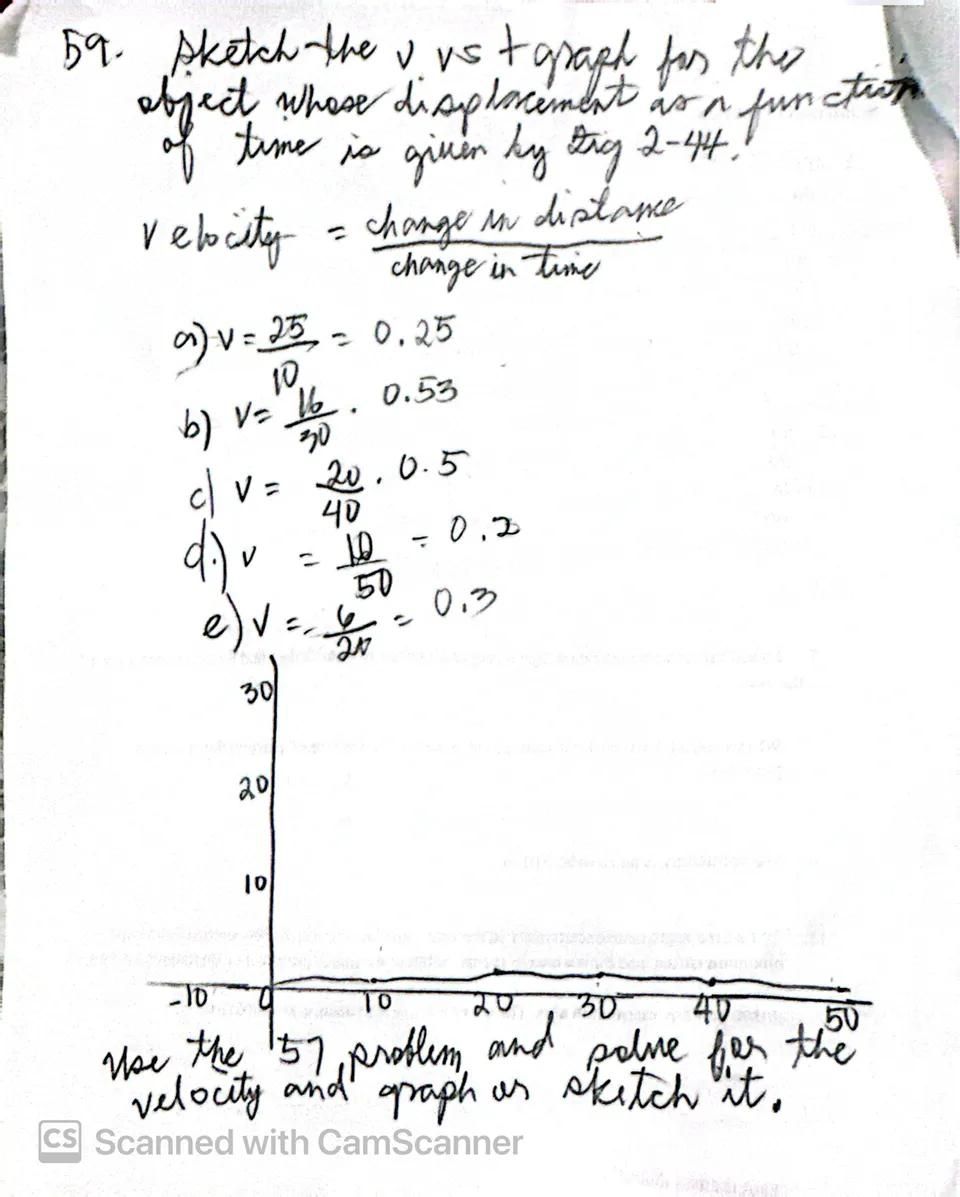 {Bq pede y ye to te |
gh when pind LE 1 or c
Tomer jo obi “2 L-4. a
- ' My Pe
| Wkly |
Av: = 0,25
“0, 0.53
by ve A
v= L.o>
q v To # 9
IN I
oe) =
k-
| i
]
| "
| 15 : =
fe, 157 oll, oad He
We ok Aprph on LEE,
This is AI generated Response.
Asked by: Gurusharan
Created at: 2025-06-27 08:04:01
Asked by: Gurusharan
Created at: 2025-06-27 08:04:01
Final Answer:
Rendered
Raw Text
Did you like this answer?
Let's break down and solve the problem step by step:
---
### **Step 1: Understand the Problem**
You are asked to **sketch the v vs t graph** (velocity vs time) for an object whose displacement as a function of time is given by a previous problem (Trig 2-44). The **velocity** is defined as:
\[
\text{velocity} = \frac{\text{change in distance}}{\text{change in time}}
\]
---
### **Step 2: Review the Calculations**
You have calculated average velocities for different intervals:
a) \( v = \frac{2.5}{10} = 0.25 \)
b) \( v = \frac{16}{30} = 0.53 \)
c) \( v = \frac{20}{40} = 0.5 \)
d) \( v = \frac{10}{50} = 0.2 \)
e) \( v = \frac{6}{20} = 0.3 \)
---
### **Step 3: Assign Times to Each Interval**
Each velocity calculation seems to represent the average velocity over a specific time interval. Let's assign the midpoint of each interval as the time associated with each calculated velocity.
- For \( \frac{2.5}{10} \), midpoint is \( t = 5 \)
- For \( \frac{16}{30} \), midpoint is \( t = 15 \)
- For \( \frac{20}{40} \), midpoint is \( t = 20 \)
- For \( \frac{10}{50} \), midpoint is \( t = 25 \)
- For \( \frac{6}{20} \), midpoint is \( t = 10 \)
Let’s arrange all data (time, velocity):
- (5, 0.25)
- (10, 0.3)
- (15, 0.53)
- (20, 0.5)
- (25, 0.2)
---
### **Step 4: Sketch the v vs t Graph**
Now, plot these points (time on x-axis, velocity on y-axis):
- At \( t = 5 \), \( v = 0.25 \)
- At \( t = 10 \), \( v = 0.3 \)
- At \( t = 15 \), \( v = 0.53 \)
- At \( t = 20 \), \( v = 0.5 \)
- At \( t = 25 \), \( v = 0.2 \)
Connect these points smoothly to approximate the v vs t graph.
---
### **Step 5: Final Answer**
#### **Table of Values:**
| Time (t) | Velocity (v) |
|----------|--------------|
| 5 | 0.25 |
| 10 | 0.3 |
| 15 | 0.53 |
| 20 | 0.5 |
| 25 | 0.2 |
#### **Graph:**
On the graph provided:
- Mark each point from the table.
- Connect the points with a smooth curve or straight lines.
---
### **Explanation**
These velocities are **average velocities** over each interval. By plotting them against the midpoint of each time interval, you get an approximate v-t graph for the object's motion as described by the displacement function.
---
### **Final Answer Summary**
- **Table of velocities at intervals is above.**
- **Graph is sketched by plotting these points and connecting them.**
- **The shape of the curve gives insight into how the object's velocity changes with time.**
If you need a more detailed plot or have the explicit displacement function from Trig 2-44, you could compute the instantaneous velocity at each point using calculus (derivative). For now, this is an approximate, step-by-step solution based on your data!
📢 Instructions:
- Ask anything relatd to above question only.
- For new Question goto :