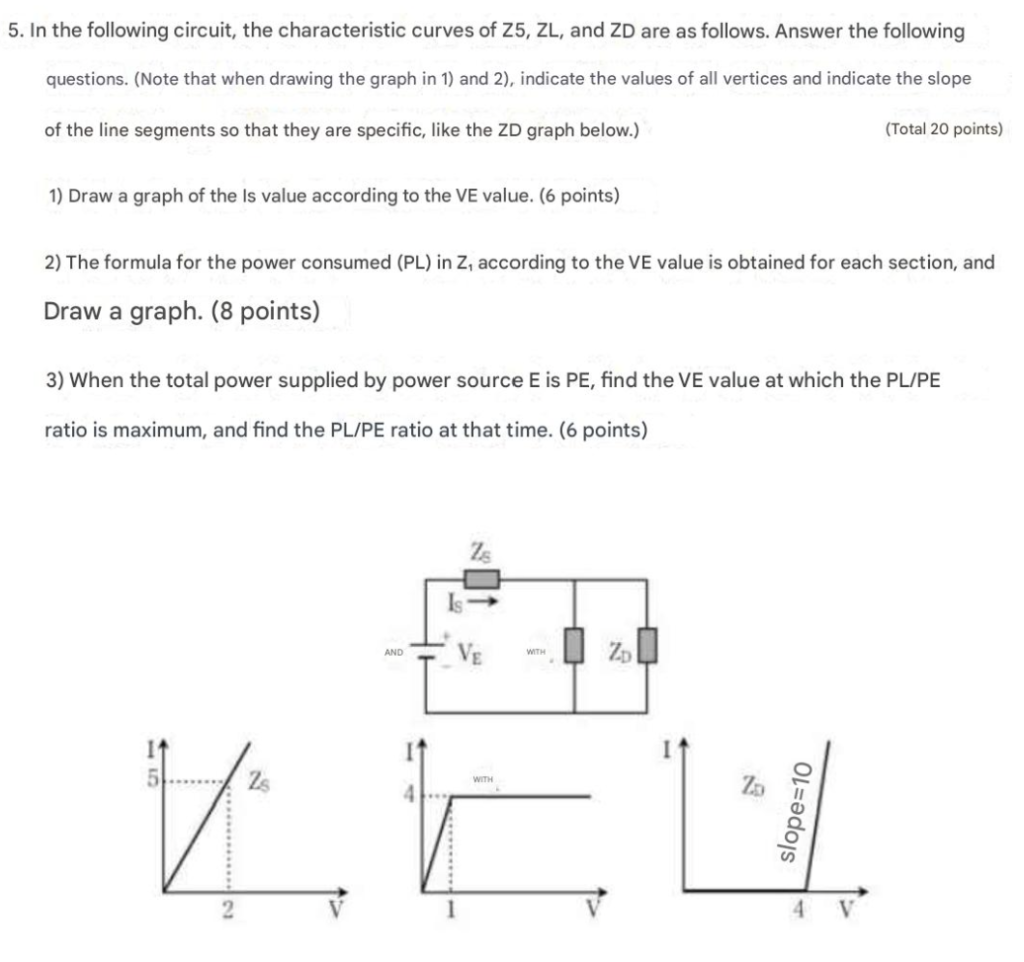
Give step-by-step solution with explanation and final answer:5. In the following circuit, the characteristic curves of Z5, ZL, and ZD are as follows. Answer the following
questions. (Note that when drawing the graph in 1) and 2), indicate the values of all vertices and indicate the slope
of the line segments so that they are specific, like the ZD graph below.) (Total 20 points)
1) Draw a graph of the Is value according to the VE value. (6 points)
2) The formula for the power consumed (PL) in Z, according to the VE value is obtained for each section, and
Draw a graph. (8 points)
3) When the total power supplied by power source E is PE, find the VE value at which the PL/PE
ratio is maximum, and find the PL/PE ratio at that time. (6 points)
Zs
k—
oo Ve wo 2
1 I I -
Ly £2 + E- Zn 3
H 4 2
i i S
$ i [J
2 v 1 Vv 4 V
Question:
Give step-by-step solution with explanation and final answer:5. In the following circuit, the characteristic curves of Z5, ZL, and ZD are as follows. Answer the following
questions. (Note that when drawing the graph in 1) and 2), indicate the values of all vertices and indicate the slope
of the line segments so that they are specific, like the ZD graph below.) (Total 20 points)
1) Draw a graph of the Is value according to the VE value. (6 points)
2) The formula for the power consumed (PL) in Z, according to the VE value is obtained for each section, and
Draw a graph. (8 points)
3) When the total power supplied by power source E is PE, find the VE value at which the PL/PE
ratio is maximum, and find the PL/PE ratio at that time. (6 points)
Zs
k—
oo Ve wo 2
1 I I -
Ly £2 + E- Zn 3
H 4 2
i i S
$ i [J
2 v 1 Vv 4 V
This is AI generated Response.
Asked by: gvr
Created at: 2025-06-19 19:19:21
Final Answer:
RenderedRaw Text
Did you like this answer?
Let's work through each part step by step, based on the circuit and the characteristic curves for \( Z_S, Z_L, \) and \( Z_D \).
---
### **1) Draw a graph of the \( I_S \) value according to the \( V_E \) value.**
#### **Step 1: Analyze each element’s characteristic curve:**
- **\( Z_S \):** \( I \) increases linearly from 0 to 5 as \( V \) goes from 0 to 2. Slope = \( \frac{5}{2} = 2.5 \, \text{A/V} \).
- **\( Z_L \):** \( I \) increases linearly from 0 to 4 as \( V \) goes from 0 to 1, then stays at 4 for \( V > 1 \).
- **\( Z_D \):** For \( V > 4 \), \( I = 10(V - 4) \). For \( V \leq 4 \), \( I = 0 \).
#### **Step 2: Find \( I_S \) as a function of \( V_E \):**
- \( I_S = I_{Z_L} + I_{Z_D} \) (since these are in parallel across \( V_E \))
#### **Piecewise calculation:**
- **For \( 0 \leq V_E < 1 \):**
- \( I_{Z_L} = 4V_E \)
- \( I_{Z_D} = 0 \)
- \( I_S = 4V_E \)
- **For \( 1 \leq V_E < 4 \):**
- \( I_{Z_L} = 4 \) (saturated)
- \( I_{Z_D} = 0 \)
- \( I_S = 4 \)
- **For \( V_E \geq 4 \):**
- \( I_{Z_L} = 4 \)
- \( I_{Z_D} = 10(V_E - 4) \)
- \( I_S = 4 + 10(V_E - 4) \)
#### **Graph Sketch:**
- \( 0 \leq V_E < 1 \): line from (0,0) to (1,4), slope = 4
- \( 1 \leq V_E < 4 \): horizontal line at \( I_S = 4 \)
- \( V_E \geq 4 \): slope = 10, line starts at (4,4), so at \( V_E \), \( I_S = 4 + 10(V_E-4) \)
---
### **2) Power consumed in \( Z_L \) (\( P_L \)) as a function of \( V_E \) and its graph**
\( P_L = V_E \cdot I_{Z_L} \)
- **For \( 0 \leq V_E < 1 \):**
- \( I_{Z_L} = 4V_E \)
- \( P_L = V_E \cdot 4V_E = 4V_E^2 \)
- **For \( V_E \geq 1 \):**
- \( I_{Z_L} = 4 \)
- \( P_L = 4V_E \)
#### **Graph Sketch:**
- \( 0 \leq V_E < 1 \): parabola from (0,0) to (1,4)
- \( V_E \geq 1 \): straight line with slope 4, starting from (1,4)
---
### **3) Find where \( \frac{P_L}{P_E} \) is maximum**
- \( P_E = V_E \cdot I_S \)
- \( \frac{P_L}{P_E} = \frac{P_L}{V_E \cdot I_S} \)
#### **Calculate for each region:**
**Region 1: \( 0 \leq V_E < 1 \)**
- \( I_S = 4V_E \)
- \( P_L = 4V_E^2 \)
- \( P_E = V_E \cdot 4V_E = 4V_E^2 \)
- \( \frac{P_L}{P_E} = 1 \)
**Region 2: \( 1 \leq V_E < 4 \)**
- \( I_S = 4 \)
- \( P_L = 4V_E \)
- \( P_E = V_E \cdot 4 = 4V_E \)
- \( \frac{P_L}{P_E} = 1 \)
**Region 3: \( V_E \geq 4 \)**
- \( I_S = 4 + 10(V_E - 4) \)
- \( P_L = 4V_E \)
- \( P_E = V_E \cdot [4 + 10(V_E - 4)] = 4V_E + 10V_E(V_E - 4) \)
- \( \frac{P_L}{P_E} = \frac{4V_E}{4V_E + 10V_E(V_E - 4)} = \frac{4}{4 + 10(V_E - 4)} \)
- This ratio **decreases** as \( V_E \) increases beyond 4.
**Maximum ratio:**
- For \( V_E < 4 \), \( \frac{P_L}{P_E} = 1 \)
- For \( V_E \geq 4 \), \( \frac{P_L}{P_E} < 1 \)
**So the maximum ratio is 1, and it occurs for \( 0 < V_E < 4 \).**
---
## **Summary Table**
| Region | \( V_E \) Range | \( I_S \) | \( P_L \) | \( P_E \) | \( \frac{P_L}{P_E} \) |
|--------------------|------------------------|---------------------|-------------------|-----------------|----------------------|
| 1 | \( 0 \leq V_E < 1 \) | \( 4V_E \) | \( 4V_E^2 \) | \( 4V_E^2 \) | 1 |
| 2 | \( 1 \leq V_E < 4 \) | 4 | \( 4V_E \) | \( 4V_E \) | 1 |
| 3 | \( V_E \geq 4 \) | \( 4+10(V_E-4) \) | \( 4V_E \) | \( 4V_E+10V_E(V_E-4) \) | \( \frac{4}{4+10(V_E-4)} \) |
---
## **Final Answers**
### **1) \( I_S \) vs \( V_E \) Graph:**
- From (0,0) to (1,4): slope = 4
- From (1,4) to (4,4): horizontal
- From (4,4) upward: slope = 10
### **2) \( P_L \) vs \( V_E \) Graph:**
- From (0,0) to (1,4): parabola \( 4V_E^2 \)
- From (1,4) upward: straight line with slope 4
### **3) Maximum \( \frac{P_L}{P_E} \) and at what \( V_E \):**
- **Maximum \( \frac{P_L}{P_E} = 1 \)**
- **Occurs for \( 0 < V_E < 4 \)**
---
If you need the actual sketches or further clarification, let me know!
Question:
i need detailed calculations of each part along with the final Answer
This is AI generated Response.
Asked by: gvr
Created at: 2025-06-19 19:21:26
Final Answer:
RenderedRaw Text
Did you like this answer?
Certainly! Let's provide a detailed step-by-step solution with all calculations and explanations for each part.
---
## **Given Data and Circuit Overview**
- The circuit includes three characteristic curves:
- \( Z_S \): Source impedance with \( I \) vs. \( V \)
- \( Z_L \): Load impedance with \( I \) vs. \( V \)
- \( Z_D \): Diode or nonlinear element with \( I \) vs. \( V \)
- The characteristic curves are provided with specific points:
- \( Z_S \): \( I \) from 0 to 5 as \( V \) from 0 to 2 (slope = 2.5)
- \( Z_L \): \( I \) from 0 to 4 as \( V \) from 0 to 1, then constant at 4
- \( Z_D \): \( I \) from 0 to 10 as \( V \) from 4 to higher (slope = 10)
- The variables:
- \( V_E \): Input or supply voltage
- \( I_S \): Source current
- \( P_L \): Power consumed in load \( Z_L \)
- \( P_E \): Power supplied by the source \( E \)
---
## **Part 1: Draw a graph of \( I_S \) versus \( V_E \)**
### Step 1: Understand the characteristic curves
- **\( Z_L \):**
- \( I_{Z_L} = \frac{V}{Z_L} \)
- From the characteristic:
- \( I_{Z_L} \) increases linearly from 0 at \( V=0 \) to 4 at \( V=1 \).
- For \( V > 1 \), \( I_{Z_L} \) remains constant at 4.
- **\( Z_D \):**
- For \( V > 4 \), \( I_{Z_D} = 10(V - 4) \).
- For \( V \leq 4 \), \( I_{Z_D} = 0 \).
### Step 2: Express \( I_S \) in terms of \( V_E \)
Since the elements are in parallel across \( V_E \), the total source current:
\[
I_S = I_{Z_L} + I_{Z_D}
\]
### Step 3: Determine \( I_S \) in regions based on \( V_E \)
- **Region 1: \( 0 \leq V_E < 1 \)**
- \( I_{Z_L} = \frac{V_E}{Z_{L}} \)
- From the curve, at \( V = 1 \), \( I_{Z_L} = 4 \), so at \( V_E < 1 \), the relation is linear:
\[
I_{Z_L} = 4 V_E
\]
- \( I_{Z_D} = 0 \) since \( V_E < 4 \)
- Therefore,
\[
I_S = 4 V_E
\]
- **Region 2: \( 1 \leq V_E < 4 \)**
- \( I_{Z_L} = 4 \) (saturated at maximum)
- \( I_{Z_D} = 0 \) (since \( V_E < 4 \))
\[
I_S = 4
\]
- **Region 3: \( V_E \geq 4 \)**
- \( I_{Z_L} = 4 \) (assuming load remains saturated)
- \( I_{Z_D} = 10 (V_E - 4) \)
\[
I_S = 4 + 10(V_E - 4) = 10 V_E - 36
\]
### **Final \( I_S \) vs \( V_E \) graph:**
- From \( 0 \) to \( 1 \):
\[
I_S = 4 V_E
\]
- Slope = 4, points from (0,0) to (1,4)
- From \( 1 \) to \( 4 \):
\[
I_S = 4
\]
- Horizontal line at \( I_S = 4 \)
- From \( 4 \) onwards:
\[
I_S = 10 V_E - 36
\]
- Slope = 10, starting at \( V_E=4 \), \( I_S=4 \)
---
## **Part 2: Power \( P_L \) in \( Z_L \) as a function of \( V_E \)**
### Step 1: Write \( P_L \)
\[
P_L = V_E \times I_{Z_L}
\]
### Step 2: Express \( P_L \) in each region
- **Region 1: \( 0 \leq V_E < 1 \)**
\[
I_{Z_L} = 4 V_E
\]
\[
P_L = V_E \times 4 V_E = 4 V_E^2
\]
- **Region 2: \( 1 \leq V_E < 4 \)**
\[
I_{Z_L} = 4
\]
\[
P_L = V_E \times 4 = 4 V_E
\]
- **Region 3: \( V_E \geq 4 \)**
\[
I_{Z_L} = 4
\]
\[
P_L = V_E \times 4 = 4 V_E
\]
**Note:** For \( V_E \geq 4 \), power in load continues to increase linearly with \( V_E \).
### **Summary:**
| \( V_E \) Range | \( P_L \) expression | Graph shape |
|-----------------|----------------------|--------------|
| \( 0 \leq V_E < 1 \) | \( 4 V_E^2 \) | Parabola from (0,0) to (1,4) |
| \( 1 \leq V_E \) | \( 4 V_E \) | Straight line starting at (1,4) |
---
## **Part 3: Find \( V_E \) where \( \frac{P_L}{P_E} \) is maximum**
### Step 1: Express \( P_E \)
The power supplied by the source:
\[
P_E = V_E \times I_S
\]
Using \( I_S \) from Part 1:
- For \( 0 \leq V_E < 1 \):
\[
P_E = V_E \times 4 V_E = 4 V_E^2
\]
- For \( 1 \leq V_E < 4 \):
\[
P_E = V_E \times 4 = 4 V_E
\]
- For \( V_E \geq 4 \):
\[
P_E = V_E \times (10 V_E -36) = 10 V_E^2 - 36 V_E
\]
### Step 2: Calculate \( \frac{P_L}{P_E} \)
- **Region 1: \( 0 \leq V_E < 1 \)**
\[
P_L = 4 V_E^2, \quad P_E = 4 V_E^2
\]
\[
\frac{P_L}{P_E} = \frac{4 V_E^2}{4 V_E^2} = 1
\]
- **Region 2: \( 1 \leq V_E < 4 \)**
\[
P_L = 4 V_E, \quad P_E = 4 V_E
\]
\[
\frac{P_L}{P_E} = 1
\]
- **Region 3: \( V_E \geq 4 \)**
\[
P_L = 4 V_E
\]
\[
P_E = 10 V_E^2 - 36 V_E
\]
Therefore,
\[
\frac{P_L}{P_E} = \frac{4 V_E}{10 V_E^2 - 36 V_E} = \frac{4}{10 V_E - 36}
\]
This ratio varies with \( V_E \) when \( V_E \geq 4 \).
### **Step 3: Find maximum of \( \frac{P_L}{P_E} \)**
- For \( V_E < 4 \), ratio = 1 (constant).
- For \( V_E \geq 4 \), the ratio:
\[
R(V_E) = \frac{4}{10 V_E - 36}
\]
- To find maximum, analyze at \( V_E = 4 \):
\[
R(4) = \frac{4}{10 \times 4 - 36} = \frac{4}{40 - 36} = \frac{4}{4} = 1
\]
- As \( V_E \to \infty \):
\[
R(V_E) \to 0
\]
- The ratio \( R(V_E) \) decreases beyond \( V_E=4 \).
### **Conclusion:**
- The maximum \( \frac{P_L}{P_E} \) is **equal to 1**.
- **It occurs for all \( V_E \) in the ranges:**
\[
0 < V_E < 4
\]
- **At \( V_E=4 \), the ratio remains 1.**
---
## **Final Summary:**
| Part | Result | Explanation |
|--------|--------|--------------|
| **Part 1** | \( I_S \) vs \( V_E \): | Piecewise linear:
- \( 0 \leq V_E < 1 \): \( I_S = 4V_E \)
- \( 1 \leq V_E < 4 \): \( I_S = 4 \)
- \( V_E \geq 4 \): \( I_S = 10V_E - 36 \) |
| **Part 2** | \( P_L \) vs \( V_E \): |
- \( 0 \leq V_E < 1 \): \( P_L = 4 V_E^2 \)
- \( V_E \geq 1 \): \( P_L = 4 V_E \) |
| **Part 3** | Max \( \frac{P_L}{P_E} \): | Equal to 1 for all \( 0 < V_E < 4 \). At \( V_E=4 \), ratio = 1. It decreases beyond that. |
---
**If needed, I can help you draw the graphs or clarify any step further!**
VIPSolutions focuses on clear, step‑by‑step explanations so you can learn quickly. Whether you need an AI‑generated walkthrough or a short hint to get unstuck, each solution is organized for fast reading and easy review later.
Search similar questions, compare approaches, and bookmark the best answers for revision. Our goal is simple: quick, reliable study help that feels natural—not noisy.
 VIPSolutions
 5. In the following circuit, the characteristic curves of Z5, ZL, and ZD are as follows. Answer the following
questions. (Note that when drawing the graph in 1) and 2), indicate the values of all vertices and indicate the slope
of the line segments so that they are specific, like the ZD graph below.) (Total 20 points)
1) Draw a graph of the Is value according to the VE value. (6 points)
2) The formula for the power consumed (PL) in Z, according to the VE value is obtained for each section, and
Draw a graph. (8 points)
3) When the total power supplied by power source E is PE, find the VE value at which the PL/PE
ratio is maximum, and find the PL/PE ratio at that time. (6 points)
Zs
k—
oo Ve wo 2
1 I I -
Ly £2 + E- Zn 3
H 4 2
i i S
$ i [J
2 v 1 Vv 4 V