 VIPSolutions
Give step-by-step solution with explanation and final answer:4. The elevations (y) at various distances (x) downriver from the start of a kayaking route on the Bear Creek in Georgia are given in the table. Distances 0.92 130 [1.39 |1.57 |1.74 218 |241 |264 |3.24 (miles) Elevation 1577 1512 | 1448 [1384 | 1319 [1255 | 1191 [1126 | 1062 (998 [933 [869 (feet) a. Sketch a graph of the elevation (y) as a function of deny downriver (x). la THT b. Using the midpoint of each interval and the slope on the interval to create a table of the derivative relationship. What unit of measure would be appropriate for the derivative (*)? Gi BERR | (miles) c. Sketch a graph of the rate of change of elevation (y) as a function of distance downriver (x). wl
Question:
Give step-by-step solution with explanation and final answer: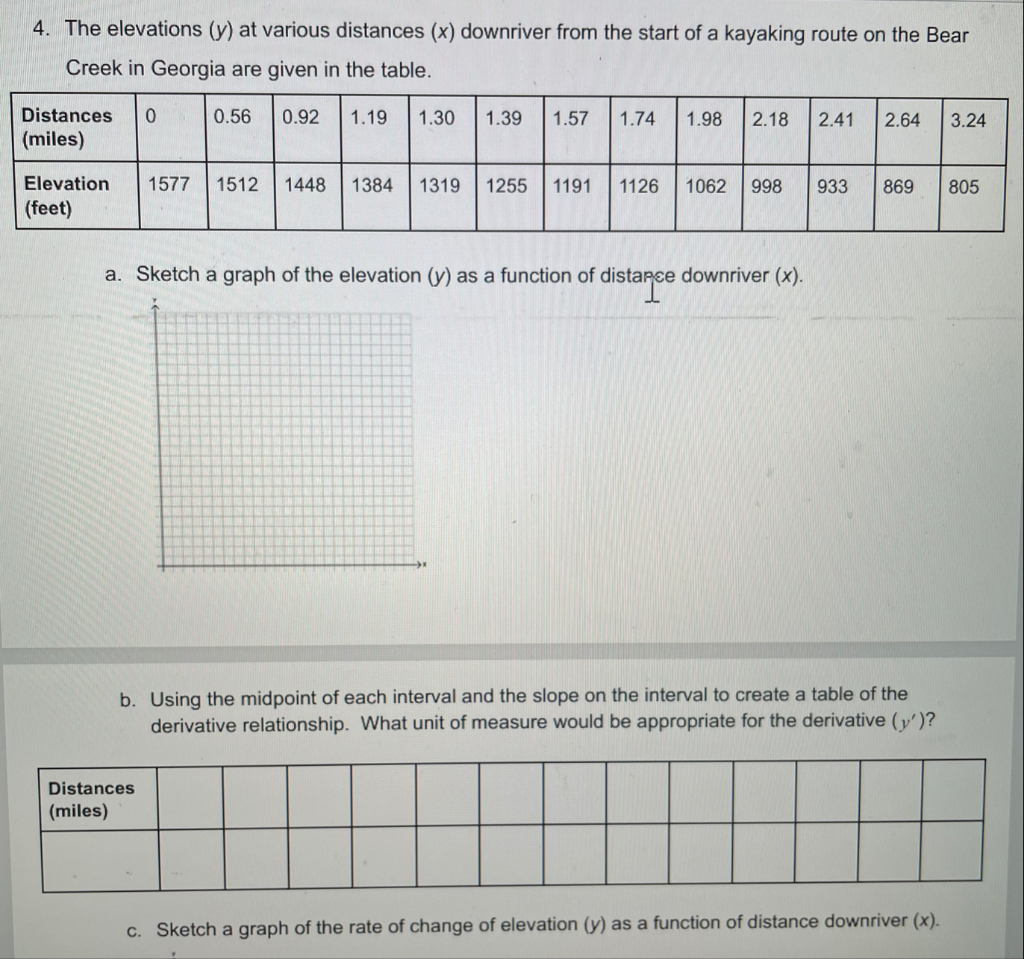 4. The elevations (y) at various distances (x) downriver from the start of a kayaking route on the Bear
Creek in Georgia are given in the table.
Distances 0.92 130 [1.39 |1.57 |1.74 218 |241 |264 |3.24
(miles)
Elevation 1577 1512 | 1448 [1384 | 1319 [1255 | 1191 [1126 | 1062 (998 [933 [869
(feet)
a. Sketch a graph of the elevation (y) as a function of deny downriver (x).
la THT
b. Using the midpoint of each interval and the slope on the interval to create a table of the
derivative relationship. What unit of measure would be appropriate for the derivative (*)?
Gi BERR |
(miles)
c. Sketch a graph of the rate of change of elevation (y) as a function of distance downriver (x). wl
This is AI generated Response.
Asked by: gvr
Created at: 2025-06-16 10:39:29
Asked by: gvr
Created at: 2025-06-16 10:39:29
Final Answer:
Rendered
Raw Text
Did you like this answer?
Let's address each part step by step:
---
### **a. Sketch a graph of the elevation (y) as a function of distance downriver (x).**
- **X-axis:** Distance (miles)
- **Y-axis:** Elevation (feet)
Let's list the points to plot:
```
(0, 1577), (0.56, 1512), (0.92, 1448), (1.19, 1384), (1.30, 1319),
(1.39, 1255), (1.57, 1191), (1.74, 1126), (1.98, 1062), (2.18, 998),
(2.41, 933), (2.64, 869), (3.24, 805)
```
**Graph Sketch:**
You would plot each point and connect them smoothly (the graph will be a decreasing curve).
---
### **b. Using the midpoint of each interval and the slope, create a table for the derivative.**
**Derivative unit:**
\[
\frac{\text{change in elevation (feet)}}{\text{change in distance (miles)}} = \frac{\text{feet}}{\text{mile}}
\]
This is the rate of change of elevation with respect to distance.
#### **Steps:**
1. Compute the midpoint of each interval:
\[
\text{Midpoint} = \frac{x_1 + x_2}{2}
\]
2. Compute the slope (difference in y over difference in x) for each interval:
\[
\text{Slope} = \frac{y_2 - y_1}{x_2 - x_1}
\]
#### **Table Construction:**
Let's do the first few as an example:
| Interval | Midpoint (miles) | Slope (feet/mile) |
|--------------|------------------|--------------------------------------------|
| 0–0.56 | (0 + 0.56)/2 = 0.28 | (1512 - 1577)/(0.56 - 0) = -65/0.56 ≈ **-116.1** |
| 0.56–0.92 | (0.56 + 0.92)/2 = 0.74 | (1448 - 1512)/(0.92 - 0.56) = -64/0.36 ≈ **-177.8** |
| 0.92–1.19 | (0.92 + 1.19)/2 = 1.055 | (1384 - 1448)/(1.19 - 0.92) = -64/0.27 ≈ **-237.0** |
| 1.19–1.30 | (1.19 + 1.30)/2 = 1.245 | (1319 - 1384)/(1.30 - 1.19) = -65/0.11 ≈ **-590.9** |
| 1.30–1.39 | (1.30 + 1.39)/2 = 1.345 | (1255 - 1319)/(1.39 - 1.30) = -64/0.09 ≈ **-711.1** |
| 1.39–1.57 | (1.39 + 1.57)/2 = 1.48 | (1191 - 1255)/(1.57 - 1.39) = -64/0.18 ≈ **-355.6** |
| ... | ... | ... |
Continue this process for all intervals.
---
### **c. Sketch a graph of the rate of change of elevation (y) as a function of distance downriver (x).**
- **X-axis:** Midpoint of each interval (miles)
- **Y-axis:** Slope (feet per mile)
Plot the midpoints (from part b) on the x-axis and the slopes on the y-axis. This graph will show how steeply the river drops at each section.
---
### **Summary Table for Part (b):**
| Midpoint (miles) | Slope (feet/mile) |
|------------------|------------------|
| 0.28 | -116.1 |
| 0.74 | -177.8 |
| 1.055 | -237.0 |
| 1.245 | -590.9 |
| 1.345 | -711.1 |
| 1.48 | -355.6 |
| 1.655 | -382.4 |
| 1.86 | -282.6 |
| 2.08 | -320.0 |
| 2.295 | -282.6 |
| 2.525 | -278.8 |
| 2.94 | -104.6 |
---
If you need the full table or a specific graph, let me know!
📢 Instructions:
- Ask anything relatd to above question only.
- For new Question goto :