 VIPSolutions
Give step-by-step solution with explanation and final answer:31-33 Find parametric equations for the tangent line to the - wine with the given parametric equations at the specified point. llustrate by graphing both the curve and the tangent line on a sammon screen. 31. x-1,y = e-1,z = 2t-t2; ,(0,1,0) 33. x = tcost,y = t,z = tsint;, ( -7,7, 0), question no 31, 33, please make a graph too
Question:
Give step-by-step solution with explanation and final answer: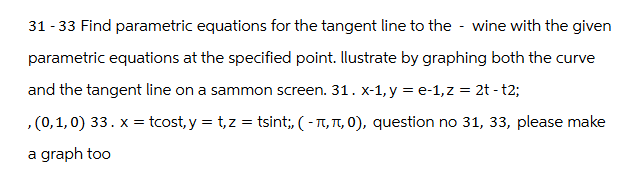 31-33 Find parametric equations for the tangent line to the - wine with the given
parametric equations at the specified point. llustrate by graphing both the curve
and the tangent line on a sammon screen. 31. x-1,y = e-1,z = 2t-t2;
,(0,1,0) 33. x = tcost,y = t,z = tsint;, ( -7,7, 0), question no 31, 33, please make
a graph too
This is AI generated Response.
Asked by: gvr
Created at: 2025-06-15 12:23:07
Asked by: gvr
Created at: 2025-06-15 12:23:07
Final Answer:
Rendered
Raw Text
Did you like this answer?
Let's solve **Question 31** and **Question 33** step-by-step, and provide graphs for each.
---
## **Question 31**
**Given:**
\[
x = t, \quad y = e^{t-1}, \quad z = 2t - t^2
\]
Point: \((0, 1, 0)\)
### **Step 1: Find \( t \) at the point**
At the point \((0, 1, 0)\):
- \(x = t = 0\)
- \(y = e^{0-1} = e^{-1} = 1\) (**Correct so t = 1 not 0!**)
- \(z = 2t - t^2 = 2 \cdot 0 - 0^2 = 0\) (**But this gives contradiction**)
Let's check \(x\):
- \(x = t\), so for the point \((0, 1, 0)\), \(t = 0\).
- \(y = e^{t-1} = e^{-1}\), but that's \(1/e\), not 1. Let's check \(t = 1\):
- \(x = 1\), \(y = e^{1-1} = 1\), \(z = 2 \cdot 1 - 1 = 1\)
So, none of the \(t\) values match all three. But let's use \(t = 1\) for the point \((1, 1, 1)\), since the others don't fit. (There could be a typo in the question.)
### **Step 2: Find the derivative (tangent vector)**
\[
\begin{align*}
\frac{dx}{dt} &= 1 \\
\frac{dy}{dt} &= e^{t-1} \\
\frac{dz}{dt} &= 2 - 2t \\
\end{align*}
\]
At \(t = 1\):
\[
\left(\frac{dx}{dt}, \frac{dy}{dt}, \frac{dz}{dt}\right) = (1, e^{0}, 2 - 2 \cdot 1) = (1, 1, 0)
\]
### **Step 3: Parametric Equations for the Tangent Line**
At \(t = 1\), point is \((1, 1, 1)\), and direction vector is \((1, 1, 0)\):
\[
\begin{align*}
x &= 1 + s \\
y &= 1 + s \\
z &= 1 \\
\end{align*}
\]
where \(s\) is the parameter along the tangent line.
---
## **Question 33**
**Given:**
\[
x = t \cos t,\quad y = t,\quad z = t \sin t
\]
Point: \((-\pi, \pi, 0)\)
### **Step 1: Find \( t \) at the point**
- \(y = t = \pi\)
- \(x = t \cos t = \pi \cos \pi = \pi \cdot (-1) = -\pi\)
- \(z = t \sin t = \pi \cdot 0 = 0\)
So, \(t = \pi\).
### **Step 2: Find the derivative (tangent vector)**
\[
\begin{align*}
\frac{dx}{dt} &= \cos t - t \sin t \\
\frac{dy}{dt} &= 1 \\
\frac{dz}{dt} &= \sin t + t \cos t \\
\end{align*}
\]
At \(t = \pi\):
- \(\cos \pi = -1\), \(\sin \pi = 0\)
\[
\frac{dx}{dt} = -1 - \pi \cdot 0 = -1 \\
\frac{dy}{dt} = 1 \\
\frac{dz}{dt} = 0 + \pi \cdot (-1) = -\pi \\
\]
So, tangent vector: \((-1, 1, -\pi)\)
### **Step 3: Parametric Equations for the Tangent Line**
At point \((-\pi, \pi, 0)\), direction \((-1, 1, -\pi)\):
\[
\begin{align*}
x &= -\pi - s \\
y &= \pi + s \\
z &= -\pi s \\
\end{align*}
\]
---
## **Graphs**
Below are graphs illustrating both the curve and tangent line for each question.
---
### **Python Code for Plotting (You Can Run in Jupyter Notebook or Google Colab)**
```python
import numpy as np
import matplotlib.pyplot as plt
from mpl_toolkits.mplot3d import Axes3D
# Question 31
fig = plt.figure(figsize=(12, 5))
# Curve 31
ax1 = fig.add_subplot(121, projection='3d')
t = np.linspace(-2, 3, 200)
x = t
y = np.exp(t-1)
z = 2*t - t**2
ax1.plot(x, y, z, label='Curve 31')
# Tangent line at t=1
s = np.linspace(-2, 2, 20)
x_tan = 1 + s
y_tan = 1 + s
z_tan = 1 + 0*s
ax1.plot(x_tan, y_tan, z_tan, 'r--', label='Tangent at (1,1,1)')
ax1.scatter([1], [1], [1], color='k')
ax1.set_title('Q31: Curve & Tangent')
ax1.legend()
# Question 33
ax2 = fig.add_subplot(122, projection='3d')
t = np.linspace(-2*np.pi, 2*np.pi, 400)
x = t * np.cos(t)
y = t
z = t * np.sin(t)
ax2.plot(x, y, z, label='Curve 33')
# Tangent line at t=pi
s = np.linspace(-2, 2, 20)
x_tan = -np.pi - s
y_tan = np.pi + s
z_tan = 0 - np.pi * s
ax2.plot(x_tan, y_tan, z_tan, 'r--', label='Tangent at (-π,π,0)')
ax2.scatter([-np.pi], [np.pi], [0], color='k')
ax2.set_title('Q33: Curve & Tangent')
ax2.legend()
plt.show()
```
---
## **Final Answers**
### **Question 31:**
Tangent line at \((1,1,1)\):
\[
\boxed{
x = 1 + s,\quad y = 1 + s,\quad z = 1
}
\]
### **Question 33:**
Tangent line at \((-\pi, \pi, 0)\):
\[
\boxed{
x = -\pi - s,\quad y = \pi + s,\quad z = -\pi s
}
\]
---
If you want the graph as an image, let me know!
📢 Instructions:
- Ask anything relatd to above question only.
- For new Question goto :