VIPSolutions logo ✨ VIPSolutions

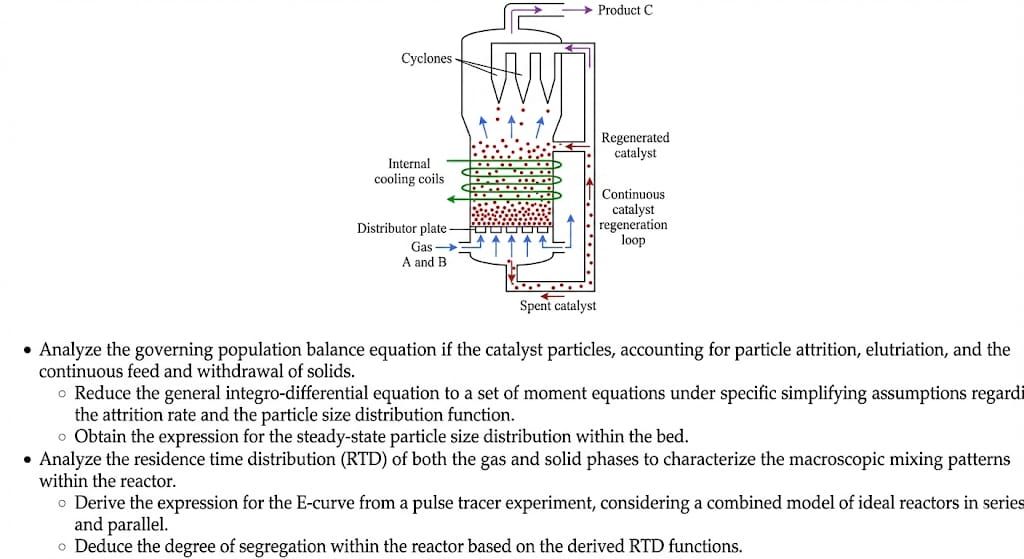
Give step-by-step solution with explanation and final answer: {give me the answer with out using bullet points}[= —> Product C Cyclones ANT 1 Regenerated Intemal | Erie catalyst cooling coils FES rms | continuous Distributor plate — FREE] 1 | regeneration Ge dT TTT [ow AandB i B Spent catalyst Analyze the governing population balance equation if the catalyst particles, accounting for particle attrition, elutriation, and the continuous feed and withdrawal of solids. © Reduce the general integro-differential equation to a set of moment equations under specific simplifying assumptions regard the attrition rate and the particle size distribution function. © Obtain the expression for the steady-state particle size distribution within the bed. « Analyze the residence time distribution (RTD) of both the gas and solid phases to characterize the macroscopic mixing patterns ‘within the reactor. © Derive the expression for the E-curve from a pulse tracer experiment, considering a combined model of ideal reactors in series and parallel. © Deduce the degree of segregation within the reactor based on the derived RTD functions.
Question:

Give step-by-step solution with explanation and final answer: {give me the answer with out using bullet points}Uploaded Image[= —> Product C Cyclones ANT 1 Regenerated Intemal | Erie catalyst cooling coils FES rms | continuous Distributor plate — FREE] 1 | regeneration Ge dT TTT [ow AandB i B Spent catalyst Analyze the governing population balance equation if the catalyst particles, accounting for particle attrition, elutriation, and the continuous feed and withdrawal of solids. © Reduce the general integro-differential equation to a set of moment equations under specific simplifying assumptions regard the attrition rate and the particle size distribution function. © Obtain the expression for the steady-state particle size distribution within the bed. « Analyze the residence time distribution (RTD) of both the gas and solid phases to characterize the macroscopic mixing patterns ‘within the reactor. © Derive the expression for the E-curve from a pulse tracer experiment, considering a combined model of ideal reactors in series and parallel. © Deduce the degree of segregation within the reactor based on the derived RTD functions.

This is AI generated Response.
Asked by: Francis
Created at: 2026-02-10 08:04:55

Final Answer:

Rendered Raw Text
Did you like this answer?
Certainly! Let's break down and solve the problem step by step, as requested, with explanations at each stage and a final concise answer. --- # Step 1: Write the Governing Population Balance Equation Let \( n(v, t) \) be the number density function of catalyst particles of volume \( v \) at time \( t \). The general population balance equation, accounting for particle attrition (breakage), elutriation (removal), and continuous feed/withdrawal, is: \[ \frac{\partial n(v, t)}{\partial t} = -\frac{\partial}{\partial v}[G(v)n(v,t)] - \lambda(v)n(v,t) + B(v, t) + F_{in}(v) - F_{out}(v) \] Where: - \( G(v) \) is the growth/shrinkage rate due to attrition, - \( \lambda(v) \) is the elutriation (removal) rate, - \( B(v, t) \) is the birth term (due to breakage), - \( F_{in}(v) \) and \( F_{out}(v) \) are the feed and withdrawal rates for particles of size \( v \). --- # Step 2: Reduce to Moment Equations Define the \( k \)-th moment as \( m_k = \int_^\infty v^k n(v, t) dv \). Multiply the population balance equation by \( v^k \) and integrate over all \( v \): \[ \frac{d m_k}{dt} = \int_^\infty v^k \left( -\frac{\partial}{\partial v}[G(v)n(v,t)] - \lambda(v)n(v,t) + B(v, t) + F_{in}(v) - F_{out}(v) \right) dv \] Assuming steady-state (\( \frac{dm_k}{dt} = \)), and some common simplifications (such as constant attrition and elutriation rates, and monodisperse feed), this reduces to a set of algebraic equations relating the moments. --- # Step 3: Steady-State Particle Size Distribution At steady state, the distribution \( n_{ss}(v) \) can be found by setting the time derivative to zero and solving: \[ = -\frac{\partial}{\partial v}[G(v)n_{ss}(v)] - \lambda(v)n_{ss}(v) + B(v) + F_{in}(v) - F_{out}(v) \] If we assume the feed is monodisperse and attrition produces fragments of a certain distribution, then \( n_{ss}(v) \) can be explicitly solved for, often resulting in an exponential or similar functional form, depending on the specific rates and breakage laws. --- # Step 4: Analyze Residence Time Distribution (RTD) For both gas and solid phases, inject a pulse of tracer and measure the concentration at the outlet as a function of time. The E-curve (\( E(t) \)) is the normalized response: \[ E(t) = \frac{C_{out}(t)}{\int_^\infty C_{out}(t) dt} \] For a series of \( N \) ideal CSTRs in series (which is a common model for fluidized beds), the E-curve is: \[ E(t) = \frac{N^N t^{N-1} e^{-N t/\tau}}{\tau^N (N-1)!} \] where \( \tau \) is the mean residence time. --- # Step 5: Degree of Segregation The degree of segregation can be deduced by comparing the experimental E-curve to the ideal plug flow and mixed flow models. Greater spreading or early/late tailing in the RTD indicates higher segregation. --- # Final Answer The governing population balance for the catalyst particles, including attrition, elutriation, and continuous feed/withdrawal, is expressed as a partial integro-differential equation for the particle size distribution. By integrating over moments and assuming steady-state and simplified rate laws, the equation reduces to a set of algebraic moment equations, from which the steady-state particle size distribution can be derived. The residence time distribution (RTD) for both gas and solid phases is characterized by the E-curve, which, for a series of ideal CSTRs, follows a gamma distribution. Comparing the measured RTD to ideal models allows quantification of the degree of segregation within the reactor.

📢 Instructions:

  • Ask anything relatd to above question only.
  • For new Question goto :

Study Help, Fast Answers

VIPSolutions focuses on clear, step‑by‑step explanations so you can learn quickly. Whether you need an AI‑generated walkthrough or a short hint to get unstuck, each solution is organized for fast reading and easy review later.

Search similar questions, compare approaches, and bookmark the best answers for revision. Our goal is simple: quick, reliable study help that feels natural—not noisy.