 VIPSolutions
Give step-by-step solution with explanation and final answer:Question Er My score: 20 pts & Show that decreasing oA beim Secremses 1013! surphus borane 18 1088 than the value conur
Question:
Give step-by-step solution with explanation and final answer: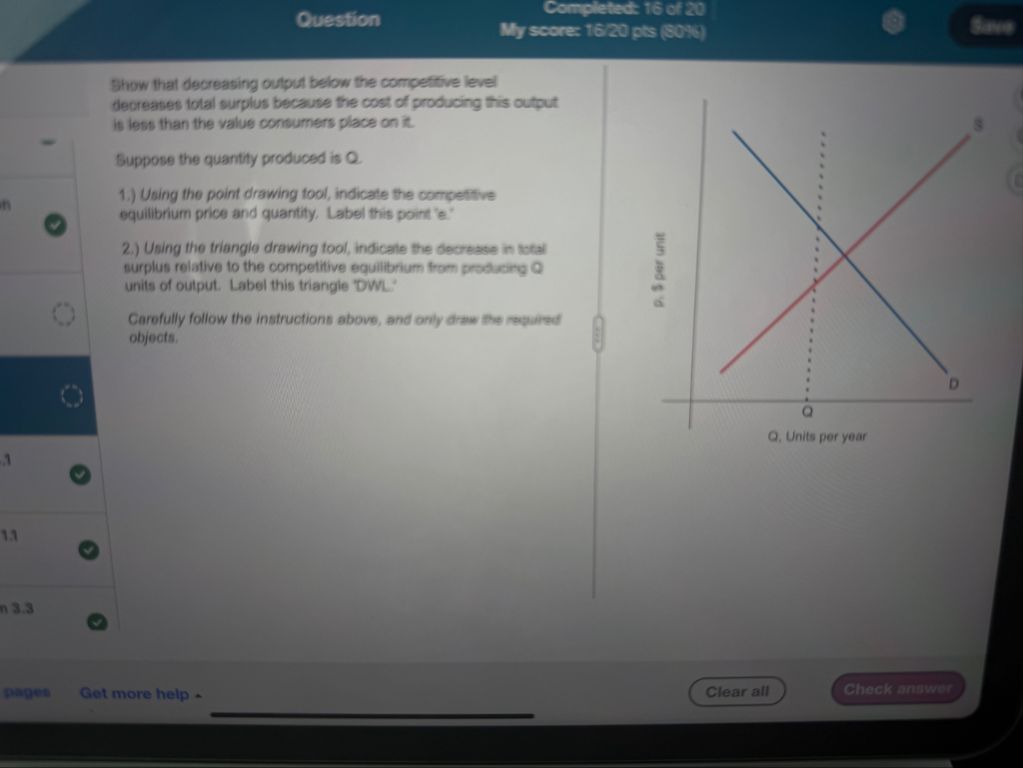 Question Er
My score: 20 pts &
Show that decreasing oA beim
Secremses 1013! surphus borane
18 1088 than the value conur
This is AI generated Response.
Asked by: Rahul
Created at: 2026-01-29 04:38:55
Asked by: Rahul
Created at: 2026-01-29 04:38:55
Final Answer:
Rendered
Raw Text
Did you like this answer?
Let's break down the steps to answer the question and illustrate the answers on the provided supply and demand diagram.
---
# Step-by-Step Solution
## **1. Marking the Competitive Equilibrium (Point 'e')**
- **Competitive equilibrium** occurs where the **demand (D)** and **supply (S)** curves intersect.
- This intersection gives the **equilibrium price (P\*)** and **equilibrium quantity (Q\*)**.
- On your graph:
- The intersection point is already shown, where the dashed vertical line from 'Q' meets the intersection of the red (S) and blue (D) lines.
- **Label this point as 'e'.**
---
## **2. Decrease in Total Surplus (Deadweight Loss, 'DWL')**
- If output decreases **below Q\***, say to Q₁ (where Q₁ < Q\*), society produces less than the efficient amount.
- The area between the demand and supply curves, from Q₁ to Q\*, represents the **lost total surplus**.
- This lost area is the **deadweight loss (DWL)** from underproduction.
### **How to Draw/Label DWL:**
1. **Find Q₁**: Choose any point to the left of Q\* on the x-axis (let’s call it Q₁).
2. **Draw a vertical line at Q₁** up to the supply and demand curves.
3. **Identify the triangle**:
- The base is between Q₁ and Q\* on the x-axis.
- The left side is the vertical line at Q₁, hitting the supply curve at the bottom and the demand curve at the top.
- The right side is the vertical line at Q\*, hitting the equilibrium point 'e'.
- The top side connects the demand curve at Q₁ to the equilibrium point.
- The bottom side connects the supply curve at Q₁ to the equilibrium point.
4. **Label this triangle area as 'DWL'**.
---
## **Explanation**
- **Why is there DWL?**
- At any quantity below Q\*, the value consumers place on the good (height of the demand curve) is greater than the cost of producing it (height of the supply curve), so not producing those units means a net loss in total surplus.
- The **DWL triangle** visually captures the lost surplus from not producing those units.
---
## **Final Answer (Summary)**
1. **Label point 'e'** at the intersection of the demand and supply curves for competitive equilibrium.
2. **Draw and label the triangle 'DWL'** between Q₁ and Q\*, bounded by the demand and supply curves, to show the decrease in total surplus from underproduction.
---
### **Diagram Guidance**
- **'e'**: Intersection of D and S at Q\*.
- **'DWL'**: Triangle between Q₁ and Q\* under the demand and supply curves.
---
### **Visual Reference (Not to Scale)**
```plaintext
Price
|
| S
| /
| /
|------/------ e (Q*, P*)
| / /
| / /
| / /
| / /
| / /
|/ / D
+-------------------
Q₁ Q*
```
- **DWL** is the triangle between Q₁ and Q*, bounded by the curves and the x-axis.
---
If you need a drawn version or further clarification, let me know!
📢 Instructions:
- Ask anything relatd to above question only.
- For new Question goto :