Give step-by-step solution with explanation and final answer:
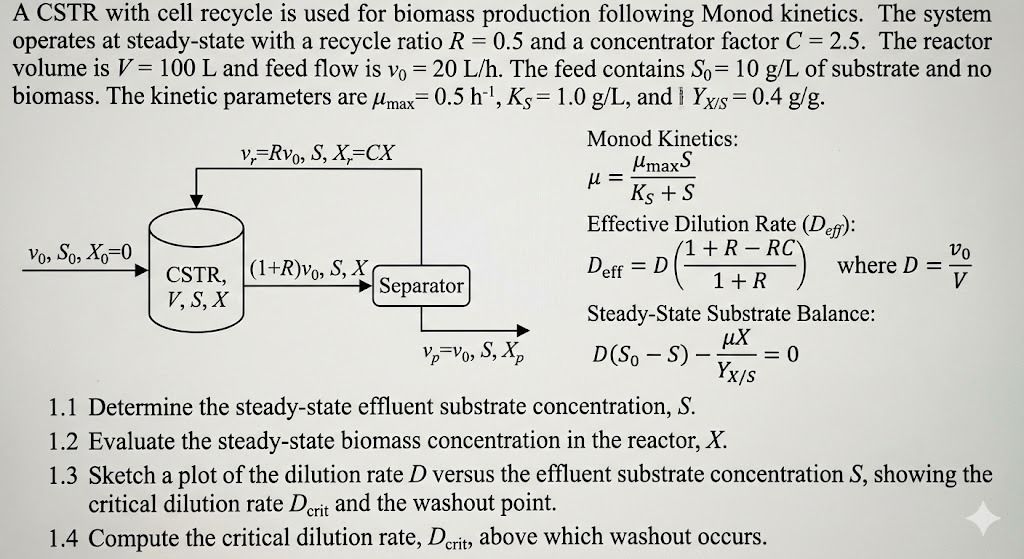
{give me the answer without using bullet-points}A CSTR with cell recycle is used for biomass production following Monod kinetics. The system
operates at steady-state with a recycle ratio R = 0.5 and a concentrator factor C = 2.5. The reactor
volume is = 100 L and feed flow is v, = 20 L/h. The feed contains Sy= 10 g/L of substrate and no
biomass. The kinetic parameters are fy,,,= 0.5 h', Ks=1.0 g/L, and | Yy,5=0.4 g/g.
v,=Rvo, S, X=CX a
C= ns
a Effective Dilution ki (Dep):
PONS = _ (1+R-R wn
Dar =D (= ) where D = 7
Steady-State Substrate Balance:
WSK, D(S-S)—t =o
Yy/s
1.1 Determine the steady-state effluent substrate concentration, S.
1.2 Evaluate the steady-state biomass concentration in the reactor, X.
1.3 Sketch a plot of the dilution rate D versus the effluent substrate concentration S, showing the
critical dilution rate Dy; and the washout point.
1.4 Compute the critical dilution rate, D.;, above which washout occurs.
Question:
Give step-by-step solution with explanation and final answer:
{give me the answer without using bullet-points}A CSTR with cell recycle is used for biomass production following Monod kinetics. The system
operates at steady-state with a recycle ratio R = 0.5 and a concentrator factor C = 2.5. The reactor
volume is = 100 L and feed flow is v, = 20 L/h. The feed contains Sy= 10 g/L of substrate and no
biomass. The kinetic parameters are fy,,,= 0.5 h', Ks=1.0 g/L, and | Yy,5=0.4 g/g.
v,=Rvo, S, X=CX a
C= ns
a Effective Dilution ki (Dep):
PONS = _ (1+R-R wn
Dar =D (= ) where D = 7
Steady-State Substrate Balance:
WSK, D(S-S)—t =o
Yy/s
1.1 Determine the steady-state effluent substrate concentration, S.
1.2 Evaluate the steady-state biomass concentration in the reactor, X.
1.3 Sketch a plot of the dilution rate D versus the effluent substrate concentration S, showing the
critical dilution rate Dy; and the washout point.
1.4 Compute the critical dilution rate, D.;, above which washout occurs.
This is AI generated Response.
Asked by: Francis
Created at: 2026-01-27 09:50:56
Final Answer:
RenderedRaw Text
Did you like this answer?
Let's solve the problem step-by-step, as requested:
---
## 1.1: Steady-State Effluent Substrate Concentration, \( S \)
First, calculate the actual dilution rate:
\[
D = \frac{v_}{V} = \frac{20}{100} = .2 \text{ h}^{-1}
\]
Calculate the effective dilution rate, \( D_{\text{eff}} \):
\[
D_{\text{eff}} = D \left( \frac{1 + R - RC}{1 + R} \right)
\]
Given \( R = .5 \), \( C = 2.5 \):
\[
1 + R - RC = 1 + .5 - (.5 \times 2.5) = 1.5 - 1.25 = .25
\]
\[
1 + R = 1.5
\]
\[
D_{\text{eff}} = .2 \left( \frac{.25}{1.5} \right) = .2 \times .1667 = .0333 \text{ h}^{-1}
\]
From steady-state substrate balance:
\[
D(S_ - S) = \frac{\mu X}{Y_{X/S}}
\]
From Monod kinetics:
\[
\mu = \frac{\mu_{\text{max}} S}{K_S + S}
\]
At steady state for CSTR with recycle, \( \mu = D_{\text{eff}} \), so:
\[
\frac{\mu_{\text{max}} S}{K_S + S} = D_{\text{eff}}
\]
\[
\mu_{\text{max}} S = D_{\text{eff}} (K_S + S)
\]
\[
\mu_{\text{max}} S = D_{\text{eff}} K_S + D_{\text{eff}} S
\]
\[
\mu_{\text{max}} S - D_{\text{eff}} S = D_{\text{eff}} K_S
\]
\[
S (\mu_{\text{max}} - D_{\text{eff}}) = D_{\text{eff}} K_S
\]
\[
S = \frac{D_{\text{eff}} K_S}{\mu_{\text{max}} - D_{\text{eff}}}
\]
Plug in the values:
\[
S = \frac{.0333 \times 1.}{.5 - .0333} = \frac{.0333}{.4667} \approx .0714 \text{ g/L}
\]
---
## 1.2: Steady-State Biomass Concentration, \( X \)
Rearrange the substrate balance:
\[
D(S_ - S) = \frac{\mu X}{Y_{X/S}}
\]
\[
X = \frac{D Y_{X/S} (S_ - S)}{\mu}
\]
Recall that at steady-state, \( \mu = D_{\text{eff}} \):
\[
X = \frac{D Y_{X/S} (S_ - S)}{D_{\text{eff}}}
\]
Plug in the values:
\[
D = .2, \quad Y_{X/S} = .4, \quad S_ = 10, \quad S = .0714, \quad D_{\text{eff}} = .0333
\]
\[
X = \frac{.2 \times .4 \times (10 - .0714)}{.0333}
= \frac{.08 \times 9.9286}{.0333}
= \frac{.7943}{.0333}
\approx 23.85 \text{ g/L}
\]
---
## 1.3: Plot of \( S \) vs. Dilution Rate \( D \) (Sketch Guidance)
To sketch the plot, use the Monod equation for \( S \) as a function of \( D_{\text{eff}} \) and thus \( D \):
\[
D_{\text{eff}} = D\left(\frac{1+R-RC}{1+R}\right)
\]
\[
S = \frac{D_{\text{eff}} K_S}{\mu_{\text{max}} - D_{\text{eff}}}
\]
Plot \( S \) on the y-axis and \( D \) on the x-axis from \( D = \) up to the critical dilution rate (see next part). The curve will increase sharply as \( D \) approaches the critical dilution rate, \( D_{\text{crit}} \).
---
## 1.4: Critical Dilution Rate \( D_{\text{crit}} \) (Washout Condition)
Washout occurs when \( D_{\text{eff}} = \mu_{\text{max}} \):
\[
D_{\text{eff,crit}} = \mu_{\text{max}}
\]
Recall:
\[
D_{\text{eff}} = D \left(\frac{1+R-RC}{1+R}\right)
\]
Let \( \alpha = \frac{1+R-RC}{1+R} \):
\[
D_{\text{crit}} = \frac{\mu_{\text{max}}}{\alpha}
\]
Plug in values:
\[
\alpha = \frac{.25}{1.5} = .1667
\]
\[
D_{\text{crit}} = \frac{.5}{.1667} = 3. \text{ h}^{-1}
\]
---
# **Summary of Answers**
1. **Steady-state effluent substrate concentration:**
\( S = .0714 \) g/L
2. **Steady-state biomass concentration:**
\( X = 23.85 \) g/L
3. **Sketch:**
Plot \( S \) versus \( D \) using \( S = \frac{D_{\text{eff}} K_S}{\mu_{\text{max}} - D_{\text{eff}}} \) up to \( D_{\text{crit}} = 3. \) h\(^{-1}\). \( S \) will rise sharply near \( D_{\text{crit}} \).
4. **Critical dilution rate (washout):**
\( D_{\text{crit}} = 3. \) h\(^{-1}\)
VIPSolutions focuses on clear, step‑by‑step explanations so you can learn quickly. Whether you need an AI‑generated walkthrough or a short hint to get unstuck, each solution is organized for fast reading and easy review later.
Search similar questions, compare approaches, and bookmark the best answers for revision. Our goal is simple: quick, reliable study help that feels natural—not noisy.
 VIPSolutions
 A CSTR with cell recycle is used for biomass production following Monod kinetics. The system
operates at steady-state with a recycle ratio R = 0.5 and a concentrator factor C = 2.5. The reactor
volume is = 100 L and feed flow is v, = 20 L/h. The feed contains Sy= 10 g/L of substrate and no
biomass. The kinetic parameters are fy,,,= 0.5 h', Ks=1.0 g/L, and | Yy,5=0.4 g/g.
v,=Rvo, S, X=CX a
C= ns
a Effective Dilution ki (Dep):
PONS = _ (1+R-R wn
Dar =D (= ) where D = 7
Steady-State Substrate Balance:
WSK, D(S-S)—t =o
Yy/s
1.1 Determine the steady-state effluent substrate concentration, S.
1.2 Evaluate the steady-state biomass concentration in the reactor, X.
1.3 Sketch a plot of the dilution rate D versus the effluent substrate concentration S, showing the
critical dilution rate Dy; and the washout point.
1.4 Compute the critical dilution rate, D.;, above which washout occurs.