 VIPSolutions
Give step-by-step solution with explanation and final answer: {give me the answer without using bullet-points}V ) NEN Ty kl TSN : = [2 A x Xie B A Xp B Xp Figure 1 AB binary phase diagram Figure 2 Gibbs energies of L, a, and f
Question:
Give step-by-step solution with explanation and final answer:
{give me the answer without using bullet-points}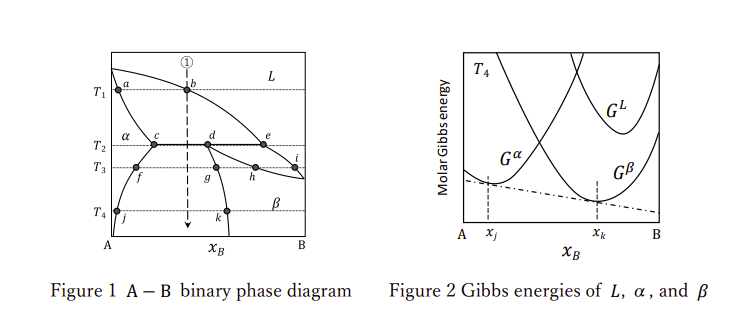 V
) NEN
Ty kl
TSN :
=
[2
A x Xie B
A Xp B Xp
Figure 1 AB binary phase diagram Figure 2 Gibbs energies of L, a, and f
This is AI generated Response.
Asked by: Francis
Created at: 2026-01-23 10:17:37
Asked by: Francis
Created at: 2026-01-23 10:17:37
Final Answer:
Rendered
Raw Text
Did you like this answer?
Let's analyze the provided figures step by step:
**Step 1: Understanding the Phase Diagram (Figure 1)**
The binary phase diagram (A-B) shows temperature (vertical axis) vs. composition (horizontal axis, \(x_B\)), with regions labeled for the phases: \(\alpha\), \(\beta\), and \(L\) (liquid). Isothermal lines \(T_1, T_2, T_3, T_4\) are drawn, and the phase boundaries (liquidus, solidus) separate single-phase and two-phase regions. The dashed vertical line at \(x_B\) indicates a specific composition.
**Step 2: Interpreting the Vertical Line**
The vertical dashed line labeled "①" at \(x_B\) represents a specific alloy composition as it cools from high temperature (top) to low temperature (bottom). The intersections with phase boundaries show where phase changes occur.
**Step 3: Relating to Gibbs Energy Curves (Figure 2)**
Figure 2 shows the molar Gibbs energies (\(G\)) for the phases \(L\), \(\alpha\), and \(\beta\) at a temperature \(T_4\). The stable phase at a given composition is the one with the lowest Gibbs energy. The common tangent construction identifies the equilibrium compositions of coexisting phases (\(x_j\) and \(x_k\)), corresponding to the endpoints of the tie-line at \(T_4\) on the phase diagram.
**Step 4: Phase Changes Along the Cooling Path**
Starting at high temperature (\(T_1\)), the system is in the liquid (\(L\)) phase. As it cools, it crosses into the two-phase (\(L+\alpha\)) region at point \(b\), where solid \(\alpha\) starts to form. At \(T_2\), the alloy consists of both \(L\) and \(\alpha\) phases. Upon further cooling to \(T_3\), all liquid has solidified, and the system moves into the two-phase (\(\alpha + \beta\)) region at point \(g\). At \(T_4\), only solid phases remain (\(\alpha + \beta\)), and the equilibrium compositions of each phase can be found using the lever rule and tie-line at that temperature.
**Step 5: Final Answer**
The vertical dashed line in the binary phase diagram represents the cooling path of an alloy with fixed composition \(x_B\). As the system cools, it undergoes the following phase changes:
- At high temperature (\(T_1\)), the alloy is fully liquid (\(L\)).
- Upon cooling, it enters the two-phase (\(L+\alpha\)) region, where solid \(\alpha\) begins to form.
- When the temperature drops further, the remaining liquid solidifies, and the system enters the two-phase (\(\alpha + \beta\)) region.
- At the lowest temperature (\(T_4\)), the alloy consists of two solid phases, \(\alpha\) and \(\beta\), with equilibrium compositions determined by the common tangent construction on the Gibbs energy diagram.
This stepwise process describes the solidification and phase evolution of a binary alloy at composition \(x_B\) according to the phase diagram and Gibbs energy curves provided.
📢 Instructions:
- Ask anything relatd to above question only.
- For new Question goto :