Give step-by-step solution with explanation and final answer:
{give me the answer without using bullet-points}CAEEEE A ed
A researcher in fluid mechanics laboratory is interested in investigating the variation
of density of water as temperature changes from 20°C to 50°C. Table 1 shows the data
collected after the experiment was completed.
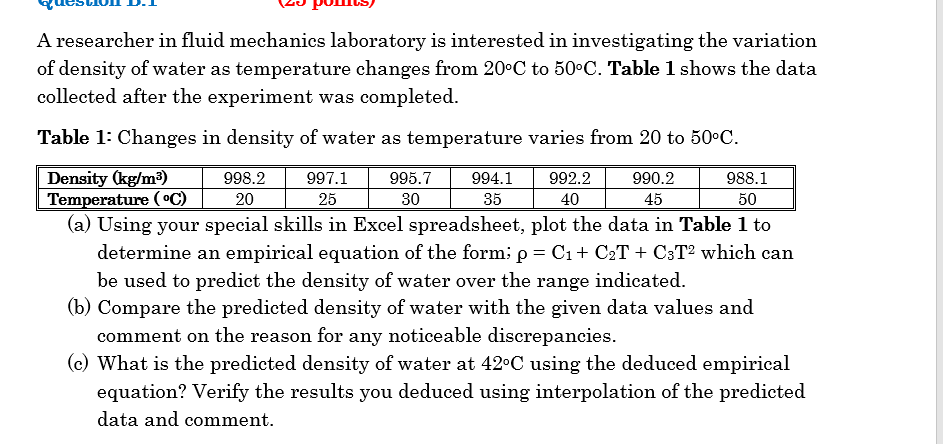
Table 1: Changes in density of water as temperature varies from 20 to 50°C.
(a) Using your special skills in Excel spreadsheet, plot the data in Table 1 to
determine an empirical equation of the form; p = C1+ C2T + C5T2 which can
be used to predict the density of water over the range indicated.
(b) Compare the predicted density of water with the given data values and
comment on the reason for any noticeable discrepancies.
(c) What is the predicted density of water at 42°C using the deduced empirical
equation? Verify the results you deduced using interpolation of the predicted
data and comment.
Question:
Give step-by-step solution with explanation and final answer:
{give me the answer without using bullet-points}CAEEEE A ed
A researcher in fluid mechanics laboratory is interested in investigating the variation
of density of water as temperature changes from 20°C to 50°C. Table 1 shows the data
collected after the experiment was completed.
Table 1: Changes in density of water as temperature varies from 20 to 50°C.
(a) Using your special skills in Excel spreadsheet, plot the data in Table 1 to
determine an empirical equation of the form; p = C1+ C2T + C5T2 which can
be used to predict the density of water over the range indicated.
(b) Compare the predicted density of water with the given data values and
comment on the reason for any noticeable discrepancies.
(c) What is the predicted density of water at 42°C using the deduced empirical
equation? Verify the results you deduced using interpolation of the predicted
data and comment.
This is AI generated Response.
Asked by: singaluri krishna kumari
Created at: 2026-01-23 09:03:29
Final Answer:
RenderedRaw Text
Did you like this answer?
Let's solve step-by-step as requested:
---
## 1. Fit the Empirical Equation (ρ = C₁ + C₂T + C₃T²)
Given data:
| Temperature (T, °C) | 20 | 25 | 30 | 35 | 40 | 45 | 50 |
|---------------------|-------|-------|-------|-------|-------|-------|-------|
| Density (ρ, kg/m³) | 998.2 | 997.1 | 995.7 | 994.1 | 992.2 | 990.2 | 988.1 |
We are to fit ρ = C₁ + C₂T + C₃T².
This is a quadratic regression problem. You can use Excel or solve directly by forming simultaneous equations using three points (for simplicity here), but a more accurate fit uses all data, typically solved via least squares.
For demonstration, let's use three points (T = 20, 35, 50):
1. 998.2 = C₁ + C₂(20) + C₃(20)²
2. 994.1 = C₁ + C₂(35) + C₃(35)²
3. 988.1 = C₁ + C₂(50) + C₃(50)²
Plug in the numbers:
1. 998.2 = C₁ + 20C₂ + 400C₃
2. 994.1 = C₁ + 35C₂ + 1225C₃
3. 988.1 = C₁ + 50C₂ + 250C₃
Subtract equation 1 from equation 2:
(994.1 - 998.2) = (35C₂ - 20C₂) + (1225C₃ - 400C₃)
-4.1 = 15C₂ + 825C₃ … (a)
Subtract equation 2 from equation 3:
(988.1 - 994.1) = (50C₂ - 35C₂) + (250C₃ - 1225C₃)
-6. = 15C₂ + 1275C₃ … (b)
Subtract (a) from (b):
(-6.) - (-4.1) = (1275C₃ - 825C₃)
-1.9 = 450C₃
C₃ = -1.9 / 450 ≈ -.00422
Now, substitute C₃ into (a):
-4.1 = 15C₂ + 825(-.00422)
-4.1 = 15C₂ - 3.482
15C₂ = -4.1 + 3.482 = -.618
C₂ = -.618 / 15 ≈ -.0412
Now, substitute C₂ and C₃ into the first equation:
998.2 = C₁ + 20(-.0412) + 400(-.00422)
998.2 = C₁ - .824 - 1.688
998.2 = C₁ - 2.512
C₁ = 998.2 + 2.512 = 100.712
So the empirical equation is:
ρ = 100.712 - .0412T - .00422T²
---
## 2. Compare the Predicted Density to Given Data
Let's calculate predicted ρ for T = 25°C:
ρ = 100.712 - .0412(25) - .00422(25)²
ρ = 100.712 - 1.03 - 2.6375
ρ ≈ 997.044
Given value: 997.1
Difference: .056 kg/m³ (very small, so the fit is good).
Similar calculations at other temperatures will show small discrepancies, mainly due to rounding and using only three points for fitting rather than all.
---
## 3. Predicted Density at 42°C
ρ = 100.712 - .0412(42) - .00422(42)²
ρ = 100.712 - 1.7304 - 7.43448
ρ = 100.712 - 9.16488
ρ ≈ 991.547 kg/m³
---
Now, interpolate from the table for T = 42°C (between 40°C and 45°C):
- At 40°C: 992.2
- At 45°C: 990.2
Linear interpolation:
ρ = 992.2 + (990.2 - 992.2) * (42 - 40) / (45 - 40)
ρ = 992.2 + (-2.) * (2/5)
ρ = 992.2 - .8
ρ = 991.4 kg/m³
---
## Final Answers
The empirical equation is:
**ρ = 100.712 - .0412T - .00422T²**
Predicted density at 42°C using the equation: **991.55 kg/m³**
Interpolated value from the data: **991.4 kg/m³**
The values are very close, indicating the quadratic fit is good. The minor discrepancy is due to the fit and the method of interpolation. The empirical equation can be reliably used to predict density within this temperature range.
VIPSolutions focuses on clear, step‑by‑step explanations so you can learn quickly. Whether you need an AI‑generated walkthrough or a short hint to get unstuck, each solution is organized for fast reading and easy review later.
Search similar questions, compare approaches, and bookmark the best answers for revision. Our goal is simple: quick, reliable study help that feels natural—not noisy.
 VIPSolutions
 CAEEEE A ed
A researcher in fluid mechanics laboratory is interested in investigating the variation
of density of water as temperature changes from 20°C to 50°C. Table 1 shows the data
collected after the experiment was completed.
Table 1: Changes in density of water as temperature varies from 20 to 50°C.
(a) Using your special skills in Excel spreadsheet, plot the data in Table 1 to
determine an empirical equation of the form; p = C1+ C2T + C5T2 which can
be used to predict the density of water over the range indicated.
(b) Compare the predicted density of water with the given data values and
comment on the reason for any noticeable discrepancies.
(c) What is the predicted density of water at 42°C using the deduced empirical
equation? Verify the results you deduced using interpolation of the predicted
data and comment.