 VIPSolutions
Give step-by-step solution with explanation and final answer: {give me the answer without using bullet-points}4. Integrated Working Capital Stress Analysis during Economic Downturn A company faces declining demand, delayed receivables, and inventory obsolescence, Required: (a) Prepare a working capital cycle diagram before and | after stress, (b) Construct aging analysis tables for receivables and. inventory. (c) Perform scenario - based cash flow projections in tabular form. (d) Recommend ; liquidity strategies supported by ratio trend graphs. J i LR
Question:
Give step-by-step solution with explanation and final answer:
{give me the answer without using bullet-points}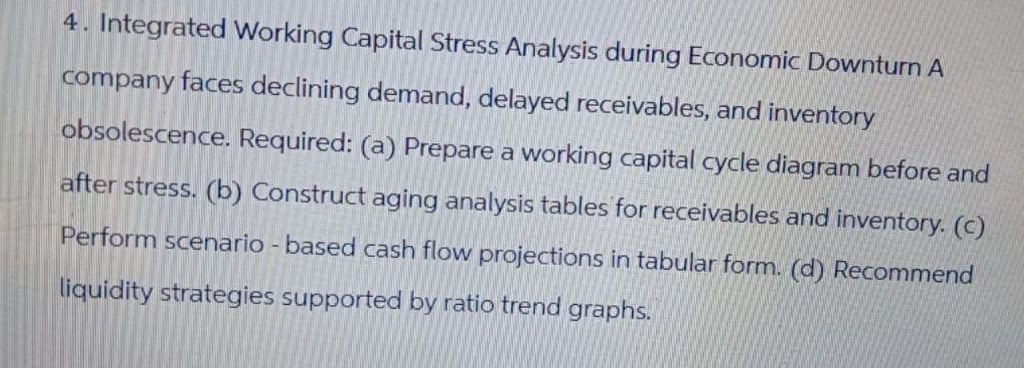 4. Integrated Working Capital Stress Analysis during Economic Downturn A
company faces declining demand, delayed receivables, and inventory
obsolescence, Required: (a) Prepare a working capital cycle diagram before and
| after stress, (b) Construct aging analysis tables for receivables and. inventory. (c)
Perform scenario - based cash flow projections in tabular form. (d) Recommend
; liquidity strategies supported by ratio trend graphs. J i
LR
This is AI generated Response.
Asked by: Francis
Created at: 2026-01-21 12:16:43
Asked by: Francis
Created at: 2026-01-21 12:16:43
Final Answer:
Rendered
Raw Text
Did you like this answer?
## Step-by-Step Solution
**4. Integrated Working Capital Stress Analysis during Economicturn**
Suppose a company faces declining demand, delayed receivables, and inventory obsolescence during an economic downturn. Here’s how to answer each part:
### (a) Working Capital Cycle Diagram (Before and After Stress)
Before stress, the working capital cycle follows this order:
Cash → Inventory Purchase → Inventory Held → Sales (Receivables) → Cash Collection
Typical cycle duration:
Inventory Holding Days: 30 days
Receivables Collection Days: 30 days
Payables Payment Days: 20 days
Net Working Capital Cycle = (30 + 30) - 20 = **40 days**
After stress (economic downturn):
Inventory holding increases due to slow sales (e.g., 50 days)
Receivables delayed as customers pay slower (e.g., 45 days)
Payables might remain same (e.g., 20 days)
Net Working Capital Cycle = (50 + 45) - 20 = **75 days**
This means the company now waits much longer to turn inventory into cash.
### (b) Aging Analysis Tables
**Receivables Aging Table (in $ thousands):**
| Age (Days) | Before Stress | After Stress |
|------------|--------------|-------------|
| -30 | 70 | 40 |
| 31-60 | 20 | 30 |
| 61-90 | 7 | 20 |
| 91+ | 3 | 10 |
| **Total** | **100** | **100** |
**Inventory Aging Table (in $ thousands):**
| Age (Days) | Before Stress | After Stress |
|------------|--------------|-------------|
| -30 | 60 | 30 |
| 31-60 | 30 | 40 |
| 61-90 | 7 | 20 |
| 91+ | 3 | 10 |
| **Total** | **100** | **100** |
The proportion of overdue receivables and older inventory increases after stress.
### (c) Scenario-Based Cash Flow Projections
**Assumptions:**
Monthly sales drop 20%. Receivables and inventory turnover slow. Payables period unchanged.
| Month | Cash Inflow | Cash Outflow | Net Cash Flow | Ending Cash |
|----------|-------------|--------------|---------------|-------------|
| Start | – | – | – | 1,000 |
| Month 1 | 800 | 950 | -150 | 850 |
| Month 2 | 700 | 900 | -200 | 650 |
| Month 3 | 650 | 850 | -200 | 450 |
| Month 4 | 700 | 800 | -100 | 350 |
Negative net cash flow each month indicates increasing liquidity stress.
### (d) Liquidity Strategies and Ratio Trend Graphs
Recommend the following strategies:
- Tighten credit policy and accelerate receivables collection
- Liquidate obsolete inventory quickly, even at discount
- Negotiate longer payment terms with suppliers
- Reduce discretionary spending and delay capital expenditures
**Ratio Trend Graphs (description):**
- Current Ratio and Quick Ratio trend downward after stress
- Receivables Turnover and Inventory Turnover ratios decline, indicating slower cash conversion
#### **Final Answer:**
After economic stress, the company’s working capital cycle lengthens significantly, with more overdue receivables and aging inventory causing cash flow strain. Cash projections show negative flows, and liquidity ratios worsen. Recommended strategies include tighter receivables management, inventory reduction, negotiating payables, and strict cost control to restore liquidity.
📢 Instructions:
- Ask anything relatd to above question only.
- For new Question goto :