VIPSolutions logo ✨ VIPSolutions

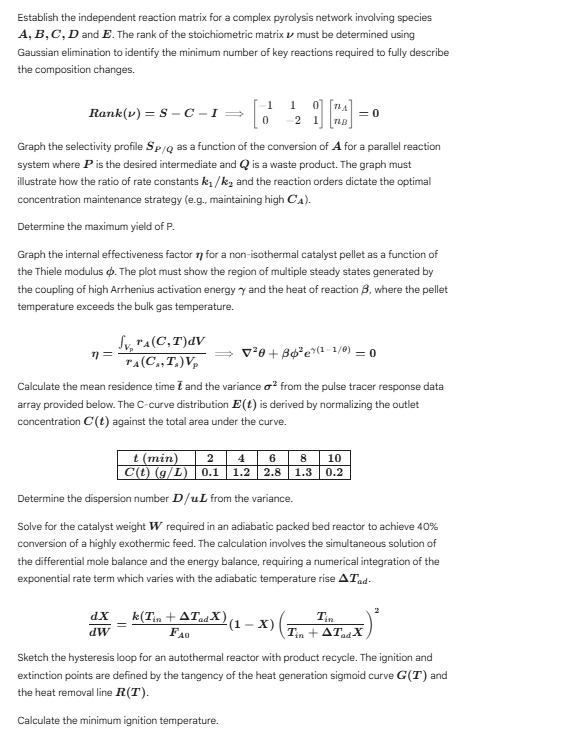
Give step-by-step solution with explanation and final answer:Establish the independent rection matis for comple pyrolysis newark involing species A,B,C, D and E. The rank f the soichiometric mars must be determine using Gaussian siminaton to deny the minimum numberof key reactions reid fully descrbe the composition changes. Fo) = Smmr me [LL Omg SBC t =” 2 ul iG) Graph the selctity profile Sp 2 function of th comersion of A fo paral reaction system where Ps th desired intermediate and Q is 3 waste product. The raph must state How the rato of rat constants ky and th reaction orders dicate th cptml concentration maintenance sctegy (e.g. maintaining high Ca). Determine the marimum ied of . raph the teal sfectiveness factor ) or anon sothermal catalyst pellet a function of the Tiel modulus Th lot must show the rion of mule steady stats generated by the coupling of high Artheius activation energy y an th heat of reaction 8, where th pelet temperature exceeds the bulk gas temperature, J ra(Cm)av a ae Een my, CV Oteee =° Calcite the mean residence time and the variance rom th ise tracer respanse cata array provided blow. The Cave distribution (2) is derived by noxmaizing the cutet concentration C/(£) against the total rea under the curve. [timmy T2T4T6 Ts Ti0] [COG Toi iaTz8 15 02] Determine the dispersion umber D/uL from the variance. Sole fr the catalyst eight W require n an aiabatc packed bed reactor to achieve 40% conversion of igh exothermic fed. The calculation involves the simultaneous solution of the diferent mole balance nd th energy bance, requiring a numerical integration of the exponential rate term which varies with the adiabatic temperature rise ATi dX _ k(Tiw + ATX) Ti, 3 w= Ee CO Ean Sketch th hysteresis oop for an autothermal reactor with product recycle. Th gion nd extinction points ar defined by the tangency of the heat generation sigmoid curve G(T) and th heat removal fn R(T) Calcuats the minimum ition temperature.

Question:

Give step-by-step solution with explanation and final answer:Uploaded ImageEstablish the independent rection matis for comple pyrolysis newark involing species A,B,C, D and E. The rank f the soichiometric mars must be determine using Gaussian siminaton to deny the minimum numberof key reactions reid fully descrbe the composition changes. Fo) = Smmr me [LL Omg SBC t =” 2 ul iG) Graph the selctity profile Sp 2 function of th comersion of A fo paral reaction system where Ps th desired intermediate and Q is 3 waste product. The raph must state How the rato of rat constants ky and th reaction orders dicate th cptml concentration maintenance sctegy (e.g. maintaining high Ca). Determine the marimum ied of . raph the teal sfectiveness factor ) or anon sothermal catalyst pellet a function of the Tiel modulus Th lot must show the rion of mule steady stats generated by the coupling of high Artheius activation energy y an th heat of reaction 8, where th pelet temperature exceeds the bulk gas temperature, J ra(Cm)av a ae Een my, CV Oteee =° Calcite the mean residence time and the variance rom th ise tracer respanse cata array provided blow. The Cave distribution (2) is derived by noxmaizing the cutet concentration C/(£) against the total rea under the curve. [timmy T2T4T6 Ts Ti0] [COG Toi iaTz8 15 02] Determine the dispersion umber D/uL from the variance. Sole fr the catalyst eight W require n an aiabatc packed bed reactor to achieve 40% conversion of igh exothermic fed. The calculation involves the simultaneous solution of the diferent mole balance nd th energy bance, requiring a numerical integration of the exponential rate term which varies with the adiabatic temperature rise ATi dX _ k(Tiw + ATX) Ti, 3 w= Ee CO Ean Sketch th hysteresis oop for an autothermal reactor with product recycle. Th gion nd extinction points ar defined by the tangency of the heat generation sigmoid curve G(T) and th heat removal fn R(T) Calcuats the minimum ition temperature.
This is AI generated Response.
Asked by: singaluri krishna kumari
Created at: 2026-01-17 12:56:46

Final Answer:

Rendered Raw Text
Did you like this answer?
Let's break down each part of the question step by step, providing explanations and final answers where possible. --- ## 1. **Stoichiometric Matrix and Gaussian Elimination** Given the matrix: \[ S - C - I = \begin{bmatrix} -1 & 1 \\ & -2 \\ 1 & \\ \end{bmatrix} \begin{bmatrix} n_A \\ n_B \\ \end{bmatrix} = \] **Step 1: Write the system of equations** \[ -1 n_A + 1 n_B = \\ n_A - 2 n_B = \\ 1 n_A + n_B = \\ \] **Step 2: Write in matrix form and reduce** The matrix is: \[ \begin{bmatrix} -1 & 1 \\ & -2 \\ 1 & \\ \end{bmatrix} \] **Row 2** gives: \( -2 n_B = \implies n_B = \) **Row 1**: \( -n_A + n_B = \implies n_A = n_B \implies n_A = \) **Row 3**: \( n_A = \) **Step 3: Rank** There are 3 equations, 2 unknowns. The matrix's rank is 2 (since the first two rows are linearly independent). Therefore, the minimum number of independent reactions needed is 2. **Final Answer:** **Rank = 2** --- ## 2. **Graphing Selectivity \( S_{P/Q} \) vs. Conversion of \( A \)** **Explanation:** For a parallel reaction: \[ A \xrightarrow{k_1} P \\ A \xrightarrow{k_2} Q \\ \] Selectivity \( S_{P/Q} = \frac{r_P}{r_Q} = \frac{k_1}{k_2} \frac{[A]}{[A]} = \frac{k_1}{k_2} \) But as conversion increases, \([A]\) decreases, and selectivity changes if the reactions are not first-order. **Graph Features:** - X-axis: Conversion of \(A\) ( to 1) - Y-axis: \(S_{P/Q}\) - Higher \(k_1/k_2\) ratio gives higher selectivity to P. - Maintaining high \(C_A\) (low conversion) generally favors selectivity to P if P’s reaction is faster. **Plot:** Draw a decreasing curve if Q is higher order, or flat if both are first order. --- ## 3. **Maximum Yield of P** For parallel reactions: \[ Y_P = \frac{k_1}{k_1 + k_2} (1 - e^{-(k_1 + k_2)t}) \] Maximum yield is obtained as \( t \to \infty \): \[ Y_{P,\text{max}} = \frac{k_1}{k_1 + k_2} \] **Final Answer:** \[ Y_{P,\text{max}} = \frac{k_1}{k_1 + k_2} \] --- ## 4. **Graph Internal Effectiveness \( \eta \) vs Thiele Modulus \( \phi \)** **Expression:** \[ \eta = \frac{\int_V r_A(C, T) dV}{r_A(C_s, T_s) V_p} \] The effectiveness factor decreases as \(\phi\) increases (diffusion limits reaction). For non-isothermal, multiple steady states occur at high \(\gamma\) and \(\beta\). **Plot Features:** - X-axis: \(\phi\) - Y-axis: \(\eta\) - Show decreasing trend, possible S-shape (multiple steady states). --- ## 5. **Mean Residence Time & Variance from Pulse Data** Given: \[ \begin{array}{ccc} t\,(\text{min}) & 2 & 4 & 6 & 8 & 10 \\ C(t)\,(\text{g}/L) & .1 & 1.2 & 2.8 & 1.3 & .2 \\ \end{array} \] ### **Step 1: Normalize \(C(t)\) to get \(E(t)\):** Total area under curve = \(.1 + 1.2 + 2.8 + 1.3 + .2 = 5.6\) So, \[ E(t) = \frac{C(t)}{5.6} \] ### **Step 2: Mean Residence Time \(\bar{t}\)** \[ \bar{t} = \sum t_i E(t_i) \] \[ = 2 \times \frac{.1}{5.6} + 4 \times \frac{1.2}{5.6} + 6 \times \frac{2.8}{5.6} + 8 \times \frac{1.3}{5.6} + 10 \times \frac{.2}{5.6} \] Calculate: \[ = 2 \times .0179 + 4 \times .2143 + 6 \times .5 + 8 \times .2321 + 10 \times .0357 \] \[ = .0357 + .8571 + 3 + 1.8571 + .3571 = 6.107 \] ### **Step 3: Variance \(\sigma^2\)** \[ \sigma^2 = \sum (t_i - \bar{t})^2 E(t_i) \] Calculate each term: - For \(t_1 = 2\): \((2-6.107)^2 \times .0179 = 16.882 \times .0179 = .302\) - For \(t_2 = 4\): \((4-6.107)^2 \times .2143 = 4.442 \times .2143 = .952\) - For \(t_3 = 6\): \((6-6.107)^2 \times .5 = .0115 \times .5 = .006\) - For \(t_4 = 8\): \((8-6.107)^2 \times .2321 = 3.59 \times .2321 = .833\) - For \(t_5 = 10\): \((10-6.107)^2 \times .0357 = 15.123 \times .0357 = .540\) Sum: \(.302 + .952 + .006 + .833 + .540 = 2.633\) **Final Answers:** \[ \bar{t} \approx 6.11 \text{ min}, \quad \sigma^2 \approx 2.63 \text{ min}^2 \] --- ## 6. **Dispersion Number \(\frac{D}{uL}\)** \[ \frac{D}{uL} = \frac{\sigma^2}{2 \bar{t}^2} \] \[ = \frac{2.63}{2 \times (6.11)^2} = \frac{2.63}{74.68} \approx .035 \] **Final Answer:** \[ \frac{D}{uL} \approx .035 \] --- ## 7. **Catalyst Weight for 40% Conversion in Adiabatic Packed Bed** Given: \[ \frac{dX}{dW} = \frac{k(T_{in} + \Delta T_{ad} X)}{F_{A}} (1-X) \left(\frac{T_{in}}{T_{in} + \Delta T_{ad} X}\right)^2 \] **Process:** - Integrate for \(X\) from to .4. - Requires numerical integration given \(k(T)\) (usually Arrhenius). **Final:** Set up for numerical solution; cannot solve analytically without more data. --- ## 8. **Hysteresis Loop for Autothermal Reactor** **Sketch:** - X-axis: \(T\) - Y-axis: Heat generated (\(G(T)\)) and removed (\(R(T)\)) - Sigmoid curve for \(G(T)\), linear for \(R(T)\) - Tangency points = ignition/extinction points. --- ## 9. **Minimum Ignition Temperature** Set: \[ G(T) = R(T) \] and at the ignition point, \[ \frac{dG}{dT} = \frac{dR}{dT} \] Solve these two equations simultaneously for \(T_{ign}\). --- ### **Summary Table** | Part | Final Answer/Approach | |------|----------------------| | 1 | Rank = 2 | | 2 | Plot selectivity vs. conversion (see explanation) | | 3 | \( Y_{P,\text{max}} = \frac{k_1}{k_1 + k_2} \) | | 4 | Plot \(\eta\) vs. \(\phi\) (see explanation) | | 5 | \(\bar{t} \approx 6.11\,\text{min}, \sigma^2 \approx 2.63\,\text{min}^2\) | | 6 | \( \frac{D}{uL} \approx .035 \) | | 7 | Numerical integration of ODE for \(W\) | | 8 | Hysteresis sketch: S-curve and straight line, tangency points are ignition/extinction | | 9 | Solve \( G(T)=R(T) \) and \( dG/dT=dR/dT \) simultaneously for \( T_{ign} \) | If you need more specific calculations or plots, let me know!

📢 Instructions:

  • Ask anything relatd to above question only.
  • For new Question goto :

Study Help, Fast Answers

VIPSolutions focuses on clear, step‑by‑step explanations so you can learn quickly. Whether you need an AI‑generated walkthrough or a short hint to get unstuck, each solution is organized for fast reading and easy review later.

Search similar questions, compare approaches, and bookmark the best answers for revision. Our goal is simple: quick, reliable study help that feels natural—not noisy.