 VIPSolutions
Give step-by-step solution with explanation and final answer:(Figure 1) shows the motion diagram of a drag racer. The camera took one frame every 2 s. For help with math skills, you may want to review: Plotting Points on a Graph BH Ba | frame every 2s ee eo ee eo eo eo ee ——————————— (m) 0 200 400 600 800
Question:
Give step-by-step solution with explanation and final answer: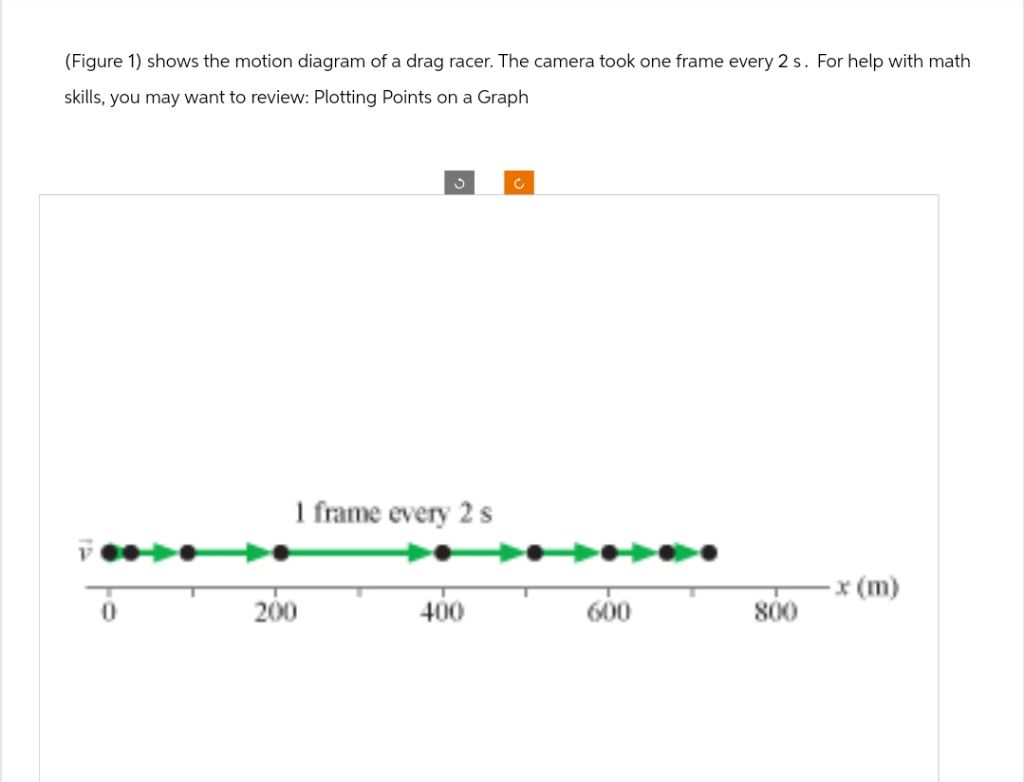 (Figure 1) shows the motion diagram of a drag racer. The camera took one frame every 2 s. For help with math
skills, you may want to review: Plotting Points on a Graph
BH Ba
| frame every 2s
ee eo ee eo eo eo
ee ——————————— (m)
0 200 400 600 800
This is AI generated Response.
Asked by: Rahul
Created at: 2026-01-16 04:20:29
Asked by: Rahul
Created at: 2026-01-16 04:20:29
Final Answer:
Rendered
Raw Text
Did you like this answer?
Let's analyze the motion diagram step by step:
---
## Step 1: **Understanding the Diagram**
- The diagram shows the position of a drag racer every 2 seconds.
- The horizontal axis is position \( x \) in meters.
- Each black dot represents the racer’s position at a 2-second interval.
- The arrows represent the motion between frames.
---
## Step 2: **Analyzing the Spacing**
- The spacing between dots increases as you move to the right (along the x-axis).
- This means the drag racer is covering more distance in the same time interval (2 s).
- **Conclusion:** The drag racer is **accelerating**.
---
## Step 3: **Interpreting Velocity**
- **Constant velocity:** Even spacing between the dots.
- **Increasing velocity (acceleration):** Increasing spacing between the dots.
- **Decreasing velocity (deceleration):** Decreasing spacing between the dots.
Here, the spacing is increasing → **acceleration**.
---
## Step 4: **Calculation Example**
Let’s estimate average velocity between first two points and last two points:
- Suppose first two points: \( x_ = \) m, \( x_1 \approx 100 \) m.
- Time between frames: \( \Delta t = 2 \) s.
**Initial velocity:**
\[
v_{initial} = \frac{x_1 - x_}{\Delta t} = \frac{100\,\text{m} - \,\text{m}}{2\,\text{s}} = 50\,\text{m/s}
\]
Suppose last two points: \( x_4 \approx 600 \) m, \( x_5 \approx 800 \) m.
**Final velocity:**
\[
v_{final} = \frac{x_5 - x_4}{\Delta t} = \frac{800\,\text{m} - 600\,\text{m}}{2\,\text{s}} = 100\,\text{m/s}
\]
---
## Step 5: **Conclusion**
- The drag racer’s velocity is **increasing** with time.
- The motion is **accelerated motion** (not constant velocity).
---
### **Final Answer**
> **The motion diagram shows that the drag racer is accelerating, as evidenced by the increasing distance between each position marker every 2 seconds.**
---
Let me know if you want the calculation of acceleration or more details!
📢 Instructions:
- Ask anything relatd to above question only.
- For new Question goto :