 VIPSolutions
Give step-by-step solution with explanation and final answer:Financial Statement Analysis Explain Common-Size Financial Statements. Draw a diagram showing vertical analysis of income statement items and their pertentage relationship. Common-Size Income Statement | CostofGoodssold 60% * Operating Expenses 25% of ales
Question:
Give step-by-step solution with explanation and final answer: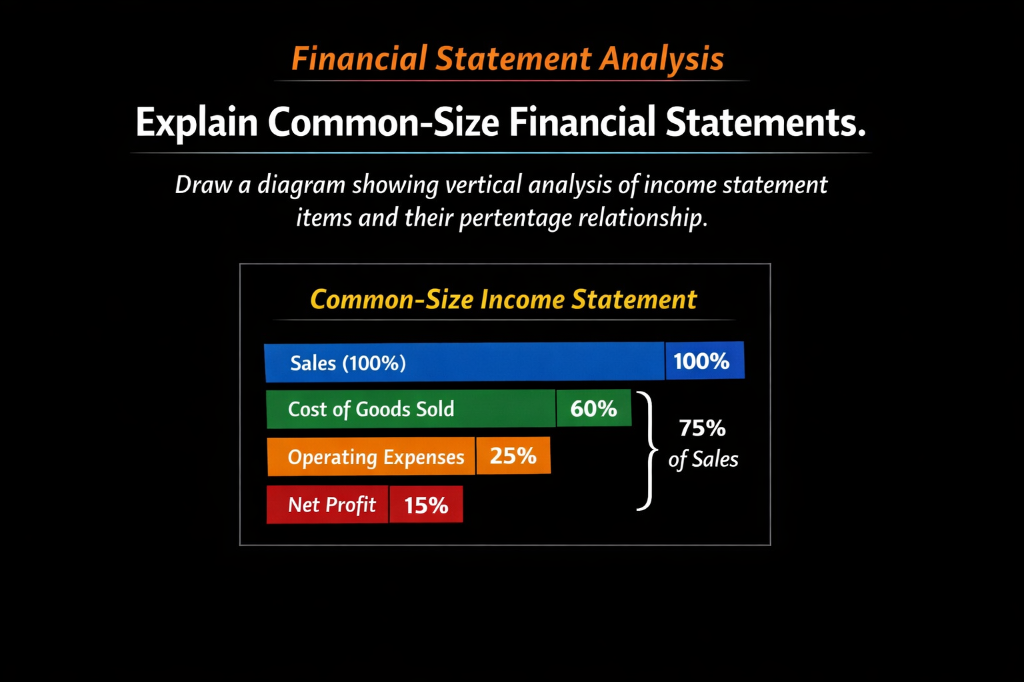 Financial Statement Analysis
Explain Common-Size Financial Statements.
Draw a diagram showing vertical analysis of income statement
items and their pertentage relationship.
Common-Size Income Statement
| CostofGoodssold 60%
* Operating Expenses 25% of ales
This is AI generated Response.
Asked by: Francis
Created at: 2026-01-03 20:30:56
Asked by: Francis
Created at: 2026-01-03 20:30:56
Final Answer:
Rendered
Raw Text
Did you like this answer?
# Step-by-Step Solution: **Common-Size Financial Statements**
## 1. **Definition**
A **Common-Size Financial Statement** is a financial report where each line item is expressed as a percentage of a base figure (usually total sales for the income statement). This helps compare companies of different sizes or track trends over time.
---
## 2. **Vertical Analysis of Income Statement**
### **Steps:**
1. **Identify the Base Figure:**
- For the income statement, **Sales (Revenue)** is typically the base (100%).
2. **Express Each Item as a Percentage of Sales:**
- Calculate each item as:
\[
\text{Percentage} = \left(\frac{\text{Item Value}}{\text{Sales}}\right) \times 100
\]
3. **Diagram Representation:**
- **Sales = 100%**
- **Cost of Goods Sold (COGS):** 60% of Sales
- **Operating Expenses:** 25% of Sales
- **Net Profit:** 15% of Sales
---
### **Diagram Explanation (From Image):**
- **Sales:** 100% (Base)
- **Cost of Goods Sold (COGS):** 60%
- **Operating Expenses:** 25%
- **Net Profit:** 15%
- **COGS + Operating Expenses = 85%** (Total expenses)
- **Net Profit is what remains after expenses (100% - 85% = 15%)**
---
## 3. **Purpose and Usefulness**
- **Comparison:** Allows easy comparison between companies and periods, regardless of size.
- **Trend Analysis:** Quickly spot changes in cost structure or profitability.
---
## 4. **Final Answer**
> **A Common-Size Financial Statement expresses each line item as a percentage of a base figure (usually sales). For example, if Sales = 100%, COGS = 60%, Operating Expenses = 25%, and Net Profit = 15%, it shows how much each item contributes to or reduces from total sales. This vertical analysis helps compare companies and analyze trends effectively.**
---
### **Summary Table (from Diagram)**
| Item | % of Sales |
|---------------------|------------|
| Sales | 100% |
| Cost of Goods Sold | 60% |
| Operating Expenses | 25% |
| Net Profit | 15% |
---
**In summary:** A common-size income statement makes it easy to analyze and compare financial performance by expressing all items as a percentage of sales.
📢 Instructions:
- Ask anything relatd to above question only.
- For new Question goto :