Give step-by-step solution with explanation and final answer:Question 4: The Pinch Analysis
Apply the Pinch Analysis by using the Problem Table Method to optimize the heat exchange
activities within an industrial plant with a process in which 4 streams can be distinguished, 2
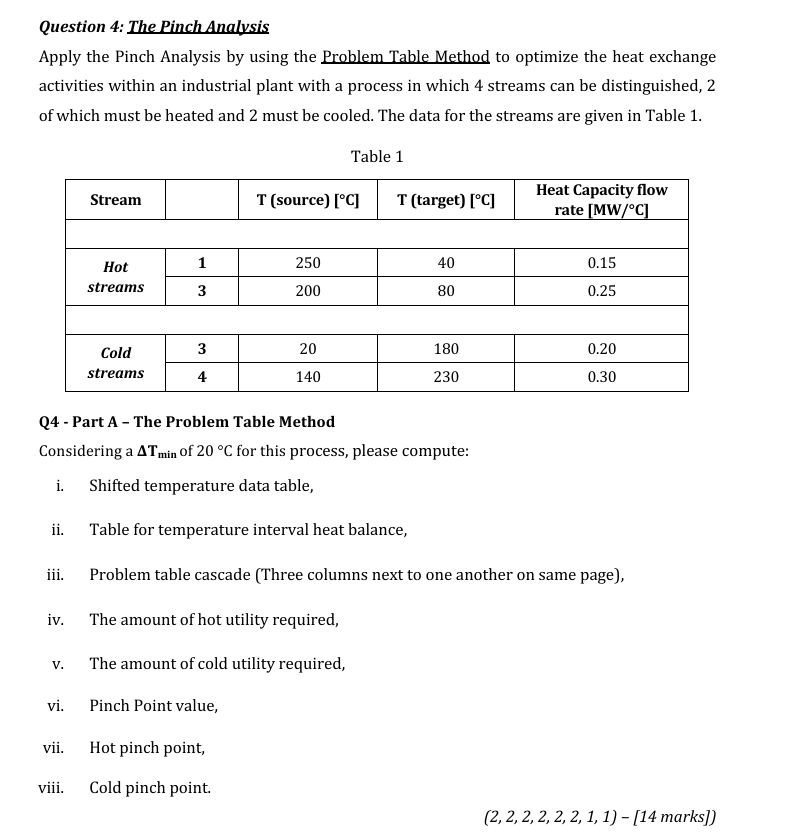
of which must be heated and 2 must be cooled. The data for the streams are given in Table 1.
Table 1
N N Heat Capacity flow
ENN T(ource) (€) | Tlargen [) rate [MW/°C]
Q4 - Part A - The Problem Table Method
Considering a Aun of 20 °C for this process, please compute:
i. Shifted temperature data table,
ii. Table for temperature interval heat balance,
iii. Problem table cascade (Three columns next to one another on same page),
iv. The amount of hot utility required,
v. The amount of cold utility required,
vi. Pinch Point value,
vii. Hot pinch point,
viii. Cold pinch point.
(2.2,2,2,2,2,1,1) - [14 marks])
Question:
Give step-by-step solution with explanation and final answer:Question 4: The Pinch Analysis
Apply the Pinch Analysis by using the Problem Table Method to optimize the heat exchange
activities within an industrial plant with a process in which 4 streams can be distinguished, 2
of which must be heated and 2 must be cooled. The data for the streams are given in Table 1.
Table 1
N N Heat Capacity flow
ENN T(ource) (€) | Tlargen [) rate [MW/°C]
Q4 - Part A - The Problem Table Method
Considering a Aun of 20 °C for this process, please compute:
i. Shifted temperature data table,
ii. Table for temperature interval heat balance,
iii. Problem table cascade (Three columns next to one another on same page),
iv. The amount of hot utility required,
v. The amount of cold utility required,
vi. Pinch Point value,
vii. Hot pinch point,
viii. Cold pinch point.
(2.2,2,2,2,2,1,1) - [14 marks])
This is AI generated Response.
Asked by: francis
Created at: 2025-12-08 09:41:30
Final Answer:
RenderedRaw Text
Did you like this answer?
Let's solve the **Pinch Analysis** problem step by step using the **Problem Table Method**.
---
# 1. **ed Temperature Data**
Given:(\Delta T_{min} = 20^\circ C\)
- For **Hot Streams**: Shift down by \(\Delta T_{min}/2 = 10^\circ C\)
- For **Cold Streams**: Shift up by \(\Delta T_{min}/2 = 10^\circ C\)
| Stream | Type | T(Source) | T(Target) | Shifted T(Source) | Shifted T(Target) | Heat Capacity (MW/°C) |
|--------|------|-----------|-----------|-------------------|-------------------|-----------------------|
| 1 | Hot | 250 | 40 | 240 | 30 | .15 |
| 2 | Hot | 200 | 80 | 190 | 70 | .25 |
| 3 | Cold | 20 | 180 | 30 | 190 | .20 |
| 4 | Cold | 140 | 230 | 150 | 240 | .30 |
---
# 2. **Temperature Intervals**
List all unique shifted temperatures (from all streams), sorted descending:
**All shifted temperatures:**
- Hot: 240, 190, 70, 30
- Cold: 30, 190, 150, 240
**Unique in order:**
240, 190, 150, 70, 30
---
# 3. **Temperature Interval Heat Balance Table**
For each interval, find which streams are active and sum \(C_p\) for hot (\(\Sigma C_{ph}\)) and cold (\(\Sigma C_{pc}\)).
| Interval | \(\Delta T\) | Active Hot Streams (\(C_{ph}\)) | Active Cold Streams (\(C_{pc}\)) | \(\Sigma C_{ph}\) | \(\Sigma C_{pc}\) | \(\Delta H = (\Sigma C_{ph} - \Sigma C_{pc}) \times \Delta T\) |
|--------------|--------------|----------------|------------------|------------|------------|----------------------------|
| 240–190 | 50 | 1, 2 | 4 | .15+.25=.40 | .30 | (.40-.30)×50 = **5.** |
| 190–150 | 40 | 2 | 4 | .25 | .30 | (.25-.30)×40 = **-2.** |
| 150–70 | 80 | 2 | None | .25 | | (.25-)×80 = **20.** |
| 70–30 | 40 | 2, 1 | 3 | .25+.15=.40 | .20 | (.40-.20)×40 = **8.** |
| 30–(lowest) | - | 1 | 3 | .15 | .20 | (.15-.20)×(no data) |
> Note: At 30°C, both hot stream 1 and cold stream 3 end/start, so interval ends.
---
# 4. **Problem Table Cascade**
Start at for the top; add each interval's \(\Delta H\):
| Interval | Interval \(\Delta H\) | Enthalpy Cascade [Cumulative] |
|------------|-----------------------|-------------------------------|
| Top | | |
| 240–190 | +5. | + 5. = 5. |
| 190–150 | -2. | 5. - 2. = 3. |
| 150–70 | +20. | 3. + 20. = 23. |
| 70–30 | +8. | 23. + 8. = 31. |
But, let's check for negative minimum value (as we need to ensure all values are non-negative):
#### Cumulative Cascade (double-checking):
- Start at
- After 1st interval: + 5 = **5**
- After 2nd interval: 5 - 2 = **3**
- After 3rd interval: 3 + 20 = **23**
- After 4th interval: 23 + 8 = **31**
All values are positive, so **no negative values** (no need to add hot utility at the top).
---
# 5. **Amount of Hot Utility Required (\(Q_h\))**
- The minimum value in the cascade is ****.
- Thus, **hot utility required = MW**.
---
# 6. **Amount of Cold Utility Required (\(Q_c\))**
- The **final value** in the cascade is **31 MW**, so **cold utility required = 31 MW**.
---
# 7. **Pinch Point Value**
- The **pinch point** occurs where the cascade is at a minimum (here, it's ).
- This occurs at **190°C** (after the second interval).
---
# 8. **Hot Pinch Point**
- **Hot pinch temperature (shifted):** 190°C
- **Unshifted hot pinch:** \(190 + \Delta T_{min}/2 = 190 + 10 = 200^\circ C\)
---
# 9. **Cold Pinch Point**
- **Cold pinch temperature (shifted):** 190°C
- **Unshifted cold pinch:** \(190 - \Delta T_{min}/2 = 190 - 10 = 180^\circ C\)
---
## **Summary Table**
| Item | Value |
|------------------------|------------------------|
| Hot utility required | MW |
| Cold utility required | 31 MW |
| Pinch Point Value | 190°C (shifted) |
| Hot Pinch Point | 200°C |
| Cold Pinch Point | 180°C |
---
## **Final Answers**
### i) Shifted temperature data table
See table in step 1.
### ii) Table for temperature interval heat balance
See table in step 3.
### iii) Problem table cascade
See step 4.
### iv) The amount of hot utility required
** MW**
### v) The amount of cold utility required
**31 MW**
### vi) Pinch Point value
**190°C (shifted)**
### vii) Hot pinch point
**200°C**
### viii) Cold pinch point
**180°C**
---
If you need the tables in a neat format or a diagram, let me know!
VIPSolutions focuses on clear, step‑by‑step explanations so you can learn quickly. Whether you need an AI‑generated walkthrough or a short hint to get unstuck, each solution is organized for fast reading and easy review later.
Search similar questions, compare approaches, and bookmark the best answers for revision. Our goal is simple: quick, reliable study help that feels natural—not noisy.
 VIPSolutions
 Question 4: The Pinch Analysis
Apply the Pinch Analysis by using the Problem Table Method to optimize the heat exchange
activities within an industrial plant with a process in which 4 streams can be distinguished, 2
of which must be heated and 2 must be cooled. The data for the streams are given in Table 1.
Table 1
N N Heat Capacity flow
ENN T(ource) (€) | Tlargen [) rate [MW/°C]
Q4 - Part A - The Problem Table Method
Considering a Aun of 20 °C for this process, please compute:
i. Shifted temperature data table,
ii. Table for temperature interval heat balance,
iii. Problem table cascade (Three columns next to one another on same page),
iv. The amount of hot utility required,
v. The amount of cold utility required,
vi. Pinch Point value,
vii. Hot pinch point,
viii. Cold pinch point.
(2.2,2,2,2,2,1,1) - [14 marks])