give step by step answer and give final summaryA quality analyst wants to construct a sample mean chart for controlling a packaging
process. He knows from past experience that when the process is operating as intended,
packaging weight is normally distributed with a mean of twenty ounces, and a process
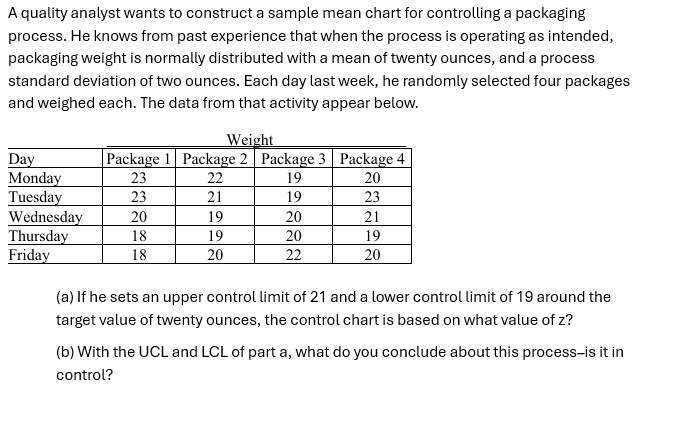
standard deviation of two ounces. Each day last week, he randomly selected four packages
and weighed each. The data from that activity appear below.
Weight
Da
Monday [23 [22 [ 19 [ 20 |
Tuesda [23 [21 [ 19 [23 |
Wednesda
Thusday | 18 [19 [ 20 [ 19 |
Friday [8 [20 [22 [ 2 7
(a) If he sets an upper control limit of 21 and a lower control limit of 19 around the
target value of twenty ounces, the control charts based on what value of 22
(b) With the UCL and LCL of part a, what do you conclude about this process-is it in
control?
Question:
give step by step answer and give final summaryA quality analyst wants to construct a sample mean chart for controlling a packaging
process. He knows from past experience that when the process is operating as intended,
packaging weight is normally distributed with a mean of twenty ounces, and a process
standard deviation of two ounces. Each day last week, he randomly selected four packages
and weighed each. The data from that activity appear below.
Weight
Da
Monday [23 [22 [ 19 [ 20 |
Tuesda [23 [21 [ 19 [23 |
Wednesda
Thusday | 18 [19 [ 20 [ 19 |
Friday [8 [20 [22 [ 2 7
(a) If he sets an upper control limit of 21 and a lower control limit of 19 around the
target value of twenty ounces, the control charts based on what value of 22
(b) With the UCL and LCL of part a, what do you conclude about this process-is it in
control?
This is AI generated Response.
Asked by: lincy
Created at: 2025-10-07 21:06:38
Final Answer:
RenderedRaw Text
Did you like this answer?
## Step-by-Step Solution
---
### **Step 1: Find the sample means for each day**
Calculate the average weight for each day.
#### **Monday:**
\[
\text{Mean} = \frac{23 + 22 + 19 + 20}{4} = \frac{84}{4} = 21
\]
#### **Tuesday:**
\[
\text{Mean} = \frac{23 + 21 + 19 + 23}{4} = \frac{86}{4} = 21.5
\]
#### **Wednesday:**
\[
\text{Mean} = \frac{20 + 19 + 20 + 21}{4} = \frac{80}{4} = 20
\]
#### **Thursday:**
\[
\text{Mean} = \frac{18 + 19 + 20 + 19}{4} = \frac{76}{4} = 19
\]
#### **Friday:**
\[
\text{Mean} = \frac{18 + 20 + 22 + 20}{4} = \frac{80}{4} = 20
\]
---
### **Step 2: List the sample means**
| Day | Mean Weight |
|----------|-------------|
| Monday | 21 |
| Tuesday | 21.5 |
| Wednesday| 20 |
| Thursday | 19 |
| Friday | 20 |
---
### **Step 3: Answer part (a) – What value of \( z \) is used?**
The control limits are set as:
- UCL (Upper Control Limit) = 21
- LCL (Lower Control Limit) = 19
The formula for control limits is:
\[
\text{UCL, LCL} = \mu \pm z \left(\frac{\sigma}{\sqrt{n}}\right)
\]
Given:
- \(\mu = 20\) (mean)
- \(\sigma = 2\) (std dev)
- \(n = 4\) (sample size)
Calculate \(\frac{\sigma}{\sqrt{n}}\):
\[
\frac{\sigma}{\sqrt{n}} = \frac{2}{\sqrt{4}} = \frac{2}{2} = 1
\]
So,
\[
\text{UCL} = 20 + z \cdot 1
\]
\[
\text{LCL} = 20 - z \cdot 1
\]
Set UCL = 21 and LCL = 19:
\[
21 = 20 + z \implies z = 1
\]
\[
19 = 20 - z \implies z = 1
\]
#### **Answer to (a):**
The control chart is based on a \( z \) value of **1**.
---
### **Step 4: Answer part (b) – Is the process in control?**
Check if all sample means are between 19 (LCL) and 21 (UCL):
- Monday: 21 (on UCL)
- Tuesday: 21.5 (**above UCL**)
- Wednesday: 20 (within limits)
- Thursday: 19 (on LCL)
- Friday: 20 (within limits)
#### **Conclusion:**
- **Tuesday's mean (21.5) is above the UCL (21).**
- At least one point outside control limits → **Process is not in control**.
---
## **Final Summary**
1. **The control chart uses a \( z \) value of 1** for the control limits.
2. **The process is not in control**, since the sample mean for Tuesday (21.5) is above the upper control limit (21).
---
**If you have follow-up questions or need more details, let me know!**
Question:
give 2 sentence summary in each steps
This is AI generated Response.
Asked by: lincy
Created at: 2025-10-07 21:07:18
Final Answer:
RenderedRaw Text
Did you like this answer?
## Step-by-Step Solution Summary
---
### **Step 1: Calculate Daily Sample Means**
Calculated the average weight for each day from the provided data. The means were found to be 21, 21.5, 20, 19, and 20 for Monday through Friday, respectively.
---
### **Step 2: List Sample Means**
Created a table to summarize the daily means of the package weights. The table provides a clear view of the average weights for each day.
---
### **Step 3: Determine \( z \) Value for Control Limits**
Used the control limit formulas to find the \( z \) value when the upper control limit (UCL) is 21 and the lower control limit (LCL) is 19. Concluded that the control chart is based on a \( z \) value of 1.
---
### **Step 4: Assess Process Control**
Evaluated the daily sample means against the control limits. Concluded that the process is not in control due to Tuesday's mean exceeding the UCL.
---
## **Final Summary**
1. A \( z \) value of 1 was determined for the control limits of the sample mean chart.
2. The process is not in control because one sample mean (Tuesday) exceeded the upper control limit.
VIPSolutions focuses on clear, step‑by‑step explanations so you can learn quickly. Whether you need an AI‑generated walkthrough or a short hint to get unstuck, each solution is organized for fast reading and easy review later.
Search similar questions, compare approaches, and bookmark the best answers for revision. Our goal is simple: quick, reliable study help that feels natural—not noisy.
 VIPSolutions
 A quality analyst wants to construct a sample mean chart for controlling a packaging
process. He knows from past experience that when the process is operating as intended,
packaging weight is normally distributed with a mean of twenty ounces, and a process
standard deviation of two ounces. Each day last week, he randomly selected four packages
and weighed each. The data from that activity appear below.
Weight
Da
Monday [23 [22 [ 19 [ 20 |
Tuesda [23 [21 [ 19 [23 |
Wednesda
Thusday | 18 [19 [ 20 [ 19 |
Friday [8 [20 [22 [ 2 7
(a) If he sets an upper control limit of 21 and a lower control limit of 19 around the
target value of twenty ounces, the control charts based on what value of 22
(b) With the UCL and LCL of part a, what do you conclude about this process-is it in
control?