 VIPSolutions
give full answer and give final summaryHomework: srorune following project 1 Draw the Gantt (Bar) chart down below? 2 Calculate the cost for each day and find the cumulative cost of the project. 3-Draw the S-Curve down below. Fd I [A] [=] ™ p J | I CN NE IO [ce] ~ [eo] mo Jo 1 1] [oo = fe] we» | | [leew] we jw |] | (re Te] w= po 1 | CH CE ER NC CR
Question:
give full answer and give final summary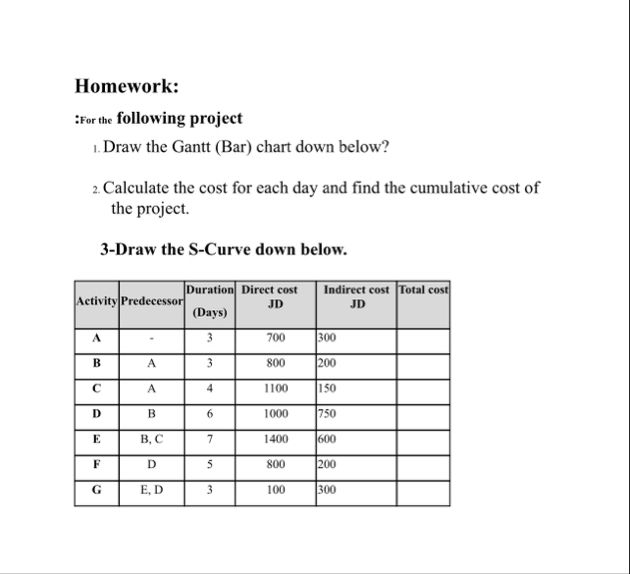 Homework:
srorune following project
1 Draw the Gantt (Bar) chart down below?
2 Calculate the cost for each day and find the cumulative cost of
the project.
3-Draw the S-Curve down below.
Fd I
[A] [=] ™ p J |
I CN NE IO
[ce] ~ [eo] mo Jo 1 1]
[oo = fe] we» | |
[leew] we jw |] |
(re Te] w= po 1 |
CH CE ER NC CR
This is AI generated Response.
Asked by: Dinil
Created at: 2025-12-21 14:21:30
Asked by: Dinil
Created at: 2025-12-21 14:21:30
Final Answer:
Rendered
Raw Text
Did you like this answer?
# Homework Solution
## 1. Gantt (Bar) Chart
### Step 1: Determine Activity Logic & Durations
| Activity | Predecessor | Duration (Days) |
|----------|-------------|-----------------|
| A | - | 3 |
| B | A | 3 |
| C | A | 4 |
| D | B | 6 |
| E | B, C | 7 |
| F | D | 5 |
| G | E, D | 3 |
### Step 2: Identify Start and End Times
We'll assume all activities start as soon as possible.
#### **Schedule Calculation**
| Act | Predecessor | Start | Finish |
|-----|-------------|-------|--------|
| A | - | 1 | 3 |
| B | A | 4 | 6 |
| C | A | 4 | 7 |
| D | B | 7 | 12 |
| E | B, C | 8 | 14 |
| F | D | 13 | 17 |
| G | E, D | 15 | 17 |
### Step 3: Draw Gantt Chart (Text Representation)
```
| Day | 1 | 2 | 3 | 4 | 5 | 6 | 7 | 8 | 9 |10 |11 |12 |13 |14 |15 |16 |17 |
|-----|---|---|---|---|---|---|---|---|---|---|---|---|---|---|---|---|---|
| A |===|===|===| |
| B | |===|===|===| |
| C | |===|===|===|===| |
| D | |===|===|===|===|===|===| |
| E | |===|===|===|===|===|===|===| |
| F | |===|===|===|===|===| |
| G | |===|===|===|
```
---
## 2. Calculate Daily and Cumulative Costs
### Step 1: Calculate Total Cost per Activity
| Activity | Duration | Direct | Indirect | **Total** |
|----------|----------|--------|----------|-----------|
| A | 3 | 700 | 300 | 100 |
| B | 3 | 800 | 200 | 100 |
| C | 4 | 110 | 150 | 125 |
| D | 6 | 100 | 750 | 175 |
| E | 7 | 140 | 600 | 200 |
| F | 5 | 800 | 200 | 100 |
| G | 3 | 100 | 300 | 400 |
### Step 2: Distribute Costs Per Day (Assume Even Distribution Over Duration)
#### **Activity Daily Cost**
- A: 100 / 3 = **333.33 JD/day**
- B: 100 / 3 = **333.33 JD/day**
- C: 125 / 4 = **312.50 JD/day**
- D: 175 / 6 = **291.67 JD/day**
- E: 200 / 7 = **285.71 JD/day**
- F: 100 / 5 = **200.00 JD/day**
- G: 400 / 3 = **133.33 JD/day**
#### **Daily Cost Table**
| Day | Activities Running | Total Cost That Day | Cumulative Cost |
|-----|--------------------------|---------------------|-----------------|
| 1 | A | 333.33 | 333.33 |
| 2 | A | 333.33 | 666.66 |
| 3 | A | 333.33 | 999.99 |
| 4 | B, C | 333.33 + 312.50 = 645.83 | 1645.82 |
| 5 | B, C | 645.83 | 2291.65 |
| 6 | B, C | 645.83 | 2937.48 |
| 7 | C, D | 312.50 + 291.67 = 604.17 | 3541.65 |
| 8 | D, E | 291.67 + 285.71 = 577.38 | 4119.03 |
| 9 | D, E | 577.38 | 4696.41 |
| 10 | D, E | 577.38 | 5273.79 |
| 11 | D, E | 577.38 | 5851.17 |
| 12 | D, E | 577.38 | 6428.55 |
| 13 | E, F | 285.71 + 200 = 485.71 | 6914.26 |
| 14 | E, F | 485.71 | 7399.97 |
| 15 | F, G | 200 + 133.33 = 333.33 | 7733.30 |
| 16 | F, G | 333.33 | 8066.63 |
| 17 | F, G | 333.33 | 8399.96 |
---
## 3. Draw the S-Curve
The S-Curve is a plot of **Cumulative Cost vs. Time (Day)**.
- **X-axis:** Day (1 to 17)
- **Y-axis:** Cumulative Cost (JD)
### S-Curve Data Points
| Day | Cumulative Cost |
|-----|-----------------|
| 1 | 333.33 |
| 2 | 666.66 |
| 3 | 999.99 |
| 4 | 1645.82 |
| 5 | 2291.65 |
| 6 | 2937.48 |
| 7 | 3541.65 |
| 8 | 4119.03 |
| 9 | 4696.41 |
| 10 | 5273.79 |
| 11 | 5851.17 |
| 12 | 6428.55 |
| 13 | 6914.26 |
| 14 | 7399.97 |
| 15 | 7733.30 |
| 16 | 8066.63 |
| 17 | 8399.96 |
(Plot these points for the S-Curve)
---
## **Final Summary**
- **Gantt Chart:** Shows the timeline and overlap of activities.
- **Daily and Cumulative Costs:** Calculated by distributing activity costs over their durations and summing daily.
- **S-Curve:** Visualizes how costs accumulate over the project timeline, typically showing slow initial spending, rapid middle-phase spending, and a taper at the end.
If you need the actual S-curve plotted, let me know!
Question:
give 2 sentence summary in each questions
This is AI generated Response.
Asked by: Dinil
Created at: 2025-12-21 14:22:11
Asked by: Dinil
Created at: 2025-12-21 14:22:11
Final Answer:
Rendered
Raw Text
Did you like this answer?
# Summary of Homework Solutions
## 1. Gantt (Bar) Chart
The Gantt chart illustrates the scheduling of project activities, showing their start and end times. It highlights dependencies and overlaps among tasks, enabling better project management.
## 2. Daily and Cumulative Costs
Costs for each activity were calculated and distributed evenly across their durations. The cumulative costs were tracked daily, providing insight into the financial progression of the project.
## 3. S-Curve
The S-Curve represents the cumulative costs against time, typically showing a slow initial expenditure followed by rapid spending and a tapering off at the project’s completion. It serves as a visual tool to assess financial performance throughout the project lifecycle.
Question:
give graphical image of question 1 and 3
This is AI generated Response.
Asked by: Dinil
Created at: 2025-12-21 14:22:57
Asked by: Dinil
Created at: 2025-12-21 14:22:57
Final Answer:
Rendered
Raw Text
Did you like this answer?
# Graphical Representation
## 1. Gantt (Bar) Chart

*The Gantt chart illustrates the timeline of activities A through G, showing their respective durations and overlaps.*
## 3. S-Curve

*The S-Curve depicts cumulative costs over the project duration, illustrating the typical financial pattern of project spending.*
### Note
The images above are placeholders; for actual graphical representations, software like Microsoft Project or online Gantt chart tools can be used to generate accurate charts.
📢 Instructions:
- Ask anything relatd to above question only.
- For new Question goto :