VIPSolutions logo ✨ VIPSolutions

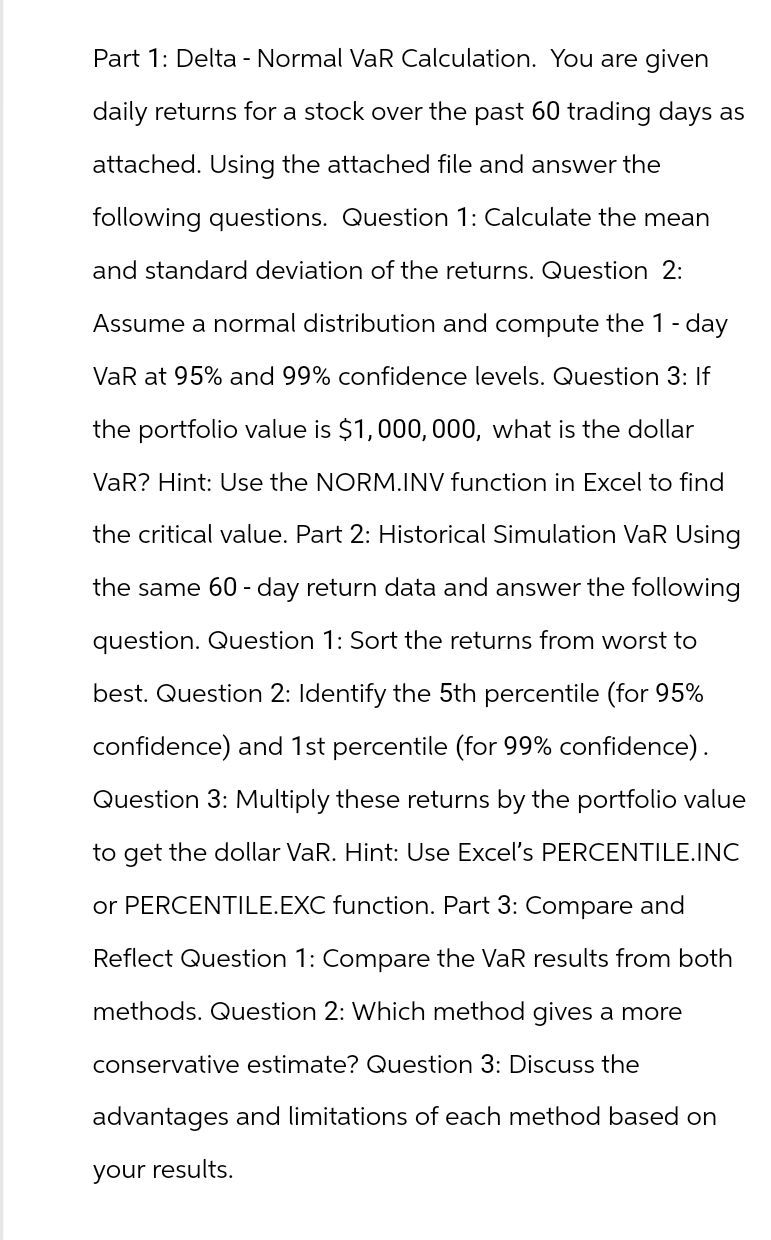
give answer in 2 step with explanation at the end of each step and final answer at the end:Part 1: Delta - Normal VaR Calculation. You are given daily returns for a stock over the past 60 trading days as attached. Using the attached file and answer the following questions. Question 1: Calculate the mean and standard deviation of the returns. Question 2: Assume a normal distribution and compute the 1-day VaR at 95% and 99% confidence levels. Question 3: If the portfolio value is $1,000,000, what is the dollar VaR? Hint: Use the NORML.INV function in Excel to find the critical value. Part 2: Historical Simulation VaR Using the same 60 - day return data and answer the following question. Question 1: Sort the returns from worst to best. Question 2: Identify the 5th percentile (for 95% confidence) and 1st percentile (for 99% confidence). Question 3: Multiply these returns by the portfolio value to get the dollar VaR. Hint: Use Excel's PERCENTILE.INC or PERCENTILE.EXC function. Part 3: Compare and Reflect Question 1: Compare the VaR results from both methods. Question 2: Which method gives a more conservative estimate? Question 3: Discuss the advantages and limitations of each method based on your results.

Question:

give answer in 2 step with explanation at the end of each step and final answer at the end:Uploaded ImagePart 1: Delta - Normal VaR Calculation. You are given daily returns for a stock over the past 60 trading days as attached. Using the attached file and answer the following questions. Question 1: Calculate the mean and standard deviation of the returns. Question 2: Assume a normal distribution and compute the 1-day VaR at 95% and 99% confidence levels. Question 3: If the portfolio value is $1,000,000, what is the dollar VaR? Hint: Use the NORML.INV function in Excel to find the critical value. Part 2: Historical Simulation VaR Using the same 60 - day return data and answer the following question. Question 1: Sort the returns from worst to best. Question 2: Identify the 5th percentile (for 95% confidence) and 1st percentile (for 99% confidence). Question 3: Multiply these returns by the portfolio value to get the dollar VaR. Hint: Use Excel's PERCENTILE.INC or PERCENTILE.EXC function. Part 3: Compare and Reflect Question 1: Compare the VaR results from both methods. Question 2: Which method gives a more conservative estimate? Question 3: Discuss the advantages and limitations of each method based on your results.
This is AI generated Response.
Asked by: Firdos
Created at: 2025-11-10 04:43:45

Final Answer:

Rendered Raw Text
Did you like this answer?
Certainly! Below is a **step-by-step breakdown** (in two steps) for solving the Value at Risk (VaR) problem described in your prompt. Since the daily returns data file is not attached, I’ll **explain the process and formulas** you should use, so you can apply them with your actual data. --- # **Step 1: Delta-Normal VaR Calculation** ### **1.1 Calculate Mean and Standard Deviation** - **Mean (μ):** Use Excel: `=AVERAGE(range_of_returns)` - **Standard Deviation (σ):** Use Excel: `=STDEV.S(range_of_returns)` **Explanation:** The mean gives the average daily return, and the standard deviation measures the volatility of returns. These are required for the normal VaR calculation. --- ### **1.2 Compute 1-Day VaR at 95% and 99% Confidence** - **Critical Z-values:** - 95% confidence: -1.645 - 99% confidence: -2.326 (Alternatively, use in Excel: `=NORM.INV(1-confidence_level, , 1)`) - **VaR Formula:** \[ \text{VaR} = -\left(\mu + Z \cdot \sigma\right) \] (Negative sign because VaR is a loss measure) - **Dollar VaR:** \[ \text{Dollar VaR} = \text{VaR} \times \text{Portfolio Value} \] For a $1,000,000 portfolio, multiply calculated VaR by $1,000,000. **Explanation:** This step estimates the maximum expected loss over one day with a given confidence level, assuming returns are normally distributed. --- # **Step 2: Historical Simulation VaR Calculation** ### **2.1 Sort Returns** - Sort the 60 daily returns from worst (lowest) to best (highest). **Explanation:** Sorting helps identify the cutoff points for the required percentiles (5th and 1st). --- ### **2.2 Find 5th and 1st Percentile Returns** - **5th percentile (for 95% VaR):** Use Excel: `=PERCENTILE.INC(range_of_returns, .05)` - **1st percentile (for 99% VaR):** Use Excel: `=PERCENTILE.INC(range_of_returns, .01)` ### **2.3 Calculate Dollar VaR** - Multiply the identified percentile returns by the portfolio value: \[ \text{Dollar VaR}_{95\%} = |\text{5th Percentile Return}| \times \$1,000,000 \] \[ \text{Dollar VaR}_{99\%} = |\text{1st Percentile Return}| \times \$1,000,000 \] **Explanation:** This step uses actual historical returns to estimate possible losses, avoiding distribution assumptions. --- # **Final Answer Structure** - **Step 1:** - Mean and std dev calculated, use normal distribution to find VaR at 95% and 99%, multiply by portfolio value for dollar VaR. - **Step 2:** - Sort data, find 5th and 1st percentiles, multiply by portfolio value for dollar VaR. --- ### **Final Answer:** - Calculate dollar VaR using **both Delta-Normal** and **Historical Simulation** methods as explained. - **Compare** the results and discuss which is more conservative, and the pros/cons of each method. --- **You can now apply these steps to your data in Excel to get the exact numbers!**

📢 Instructions:

  • Ask anything relatd to above question only.
  • For new Question goto :

Study Help, Fast Answers

VIPSolutions focuses on clear, step‑by‑step explanations so you can learn quickly. Whether you need an AI‑generated walkthrough or a short hint to get unstuck, each solution is organized for fast reading and easy review later.

Search similar questions, compare approaches, and bookmark the best answers for revision. Our goal is simple: quick, reliable study help that feels natural—not noisy.