 VIPSolutions
give answer in 2 step with explanation at the end of each step and final answer at the end:3) Shown below isthe graph of Y(5£ = 2.09) for a pulse travelling tothe ef witha speed of 20 ms. Draw raph of (x = ~20 1m.) 4 ] 4m 2m | 2m 4h fem ee
Question:
give answer in 2 step with explanation at the end of each step and final answer at the end: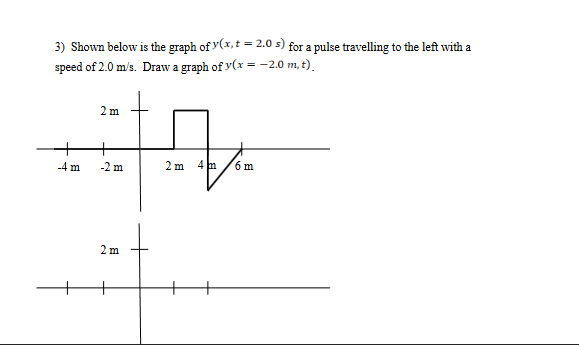 3) Shown below isthe graph of Y(5£ = 2.09) for a pulse travelling tothe ef witha
speed of 20 ms. Draw raph of (x = ~20 1m.)
4 ]
4m 2m | 2m 4h fem
ee
This is AI generated Response.
Asked by: Firdos
Created at: 2025-11-10 03:55:34
Asked by: Firdos
Created at: 2025-11-10 03:55:34
Final Answer:
Rendered
Raw Text
Did you like this answer?
Let's break down the problem step-by-step:
---
## **Step 1: Understand the pulse movement and the relation between \( x \) and \( t \)**
- The pulse is traveling **to the left** with a speed of \( v = 2.\, \text{m/s} \).
- The given graph is \( y(x, t=2.\, \text{s}) \).
- We are to find \( y(x = -2.\, \text{m}, t) \), i.e., how the displacement at \( x = -2. \) m changes with time.
**Explanation:**
For a pulse moving **left** at speed \( v \), the general form is \( y(x, t) = f(x + vt) \).
So, at \( x = -2. \) m, \( y(-2., t) = f(-2. + 2.t) \).
---
## **Step 2: Relate the new graph to the original**
- From the original graph, \( y(x, 2.) = f(x + 2. \times 2.) = f(x + 4.) \).
- To relate this to \( y(-2., t) \), set \( x + 4. = -2. + 2.t \).
- Therefore, when \( x = a \) in the original graph, in the new graph, \( t = \frac{a + 6}{2} \).
**Explanation:**
The shape of the graph will be the **same as the original**, but the x-axis values (positions) will become t-axis values (time), shifted and scaled accordingly.
---
## **Final Answer: The new graph**
- The graph of \( y(x = -2.\, \text{m}, t) \) as a function of \( t \) will look **identical in shape** to the original, but the "position" values are now time values:
- Where the original graph has a step from \( x = \) to \( x = 2 \), the new graph will have a step from \( t = 1 \) to \( t = 3 \) (since \( t = \frac{x + 6}{2} \)).
- Similarly, map all x-values to t-values using \( t = \frac{x + 6}{2} \).
**Summary Table:**
| Original x (m) | New t (s) |
|:--------------:|:---------:|
| | 3 |
| 2 | 4 |
| 4 | 5 |
| 6 | 6 |
- So, the graph for \( y(-2., t) \) will be:
- for \( t < 3 \)
- 2 from \( t = 3 \) to \( t = 4 \)
- from \( t = 4 \) to \( t = 5 \)
- -2 linearly from \( t = 5 \) to \( t = 6 \)
- for \( t > 6 \)
**Sketch:**
Replicate the original shape but plot it against \( t \), starting at \( t = 3 \) s.
---
### **Final Answer**
The required graph of \( y(x = -2.\, \text{m}, t) \) as a function of \( t \) is a step starting at \( t = 3 \) s and ending at \( t = 6 \) s, matching the original shape but shifted and stretched according to the above mapping.
📢 Instructions:
- Ask anything relatd to above question only.
- For new Question goto :