VIPSolutions logo ✨ VIPSolutions

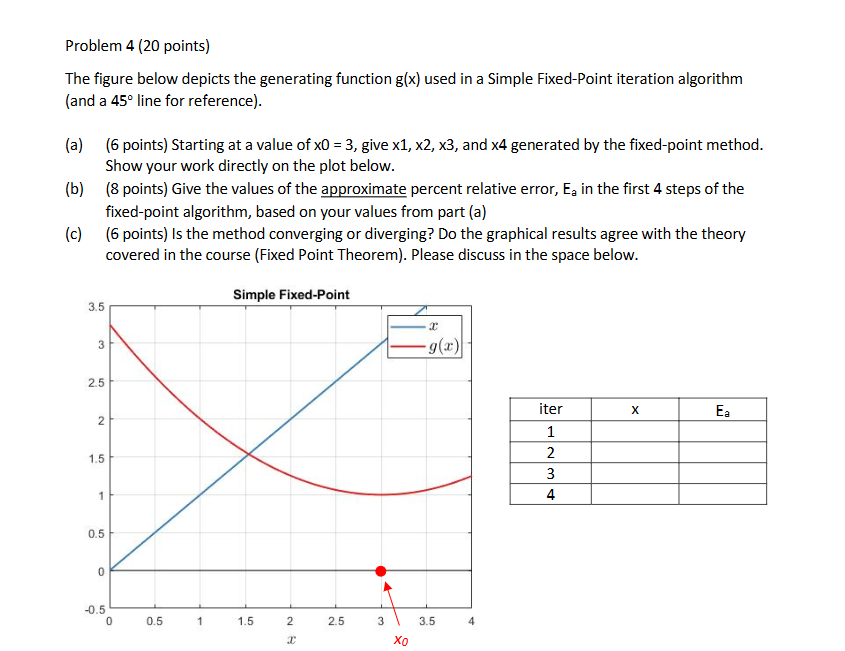
give answer in 2 step with explanation at the end of each step and final answer at the end: Solving a,b,c.Problem 4 (20 points) The figure below depicts the generating function g(x) used in a Simple Fixed-Point iteration algorithm (and a 45° line for reference). (a) (6 points) Starting at a value of x0 = 3, give x1, x2, x3, and x4 generated by the fixed-point method. Show your work directly on the plot below. (b) (8 points) Give the values of the approximate percent relative error, Es in the first 4 steps of the fixed-point algorithm, based on your values from part (a) (9) (6 points) Is the method converging or diverging? Do the graphical results agree with the theory covered in the course (Fixed Point Theorem). Please discuss in the space below. Simple Fixed-Point as —= s — os) 25 p I ET ET I 15 [2 [7 [Cs [7 ' Ce [7] 0s TTT TTT RT] 0s 0 os 1 1s 2 25 3\ 35 4 x xo
Question:

give answer in 2 step with explanation at the end of each step and final answer at the end: Solving a,b,c.Uploaded ImageProblem 4 (20 points) The figure below depicts the generating function g(x) used in a Simple Fixed-Point iteration algorithm (and a 45° line for reference). (a) (6 points) Starting at a value of x0 = 3, give x1, x2, x3, and x4 generated by the fixed-point method. Show your work directly on the plot below. (b) (8 points) Give the values of the approximate percent relative error, Es in the first 4 steps of the fixed-point algorithm, based on your values from part (a) (9) (6 points) Is the method converging or diverging? Do the graphical results agree with the theory covered in the course (Fixed Point Theorem). Please discuss in the space below. Simple Fixed-Point as —= s — os) 25 p I ET ET I 15 [2 [7 [Cs [7 ' Ce [7] 0s TTT TTT RT] 0s 0 os 1 1s 2 25 3\ 35 4 x xo

This is AI generated Response.
Asked by: Pagal
Created at: 2025-06-24 13:05:43

Final Answer:

Rendered Raw Text
Did you like this answer?
Let's solve the problem step by step as requested: --- ### **Step 1: Find x₁, x₂, x₃, and x₄ using the Fixed-Point Iteration** **Explanation:** In the fixed-point method, each next value is found by evaluating the function at the previous value: \[ x_{n+1} = g(x_n) \] Start with \( x_0 = 3 \), and use the plot to estimate \( g(x) \) at each step: #### 1. **Find x₁:** - Go vertically from \( x_0 = 3 \) to the curve \( g(x) \). - At \( x = 3 \), \( g(3) \approx 0.5 \). - So, \( x_1 \approx 0.5 \). #### 2. **Find x₂:** - Now go horizontally to the 45° line (\( x = y \)), then vertically to \( g(x) \) at \( x_1 \). - \( g(0.5) \approx 2.5 \). - So, \( x_2 \approx 2.5 \). #### 3. **Find x₃:** - \( g(2.5) \approx 1.0 \). - So, \( x_3 \approx 1.0 \). #### 4. **Find x₄:** - \( g(1.0) \approx 2.0 \). - So, \( x_4 \approx 2.0 \). **Summary Table (Step 1):** | iter | x | |------|-------| | 1 | 0.5 | | 2 | 2.5 | | 3 | 1.0 | | 4 | 2.0 | --- ### **Step 2: Calculate the Approximate Percent Relative Error for Each Iteration** **Explanation:** The approximate percent relative error at each step is: \[ E_a = \left| \frac{x_{n+1} - x_n}{x_{n+1}} \right| \times 100\% \] Let's calculate: #### - After first iteration (x₀ to x₁): \[ E_{a,1} = \left| \frac{0.5 - 3.0}{0.5} \right| \times 100\% = \left| \frac{-2.5}{0.5} \right| \times 100\% = 500\% \] #### - After second iteration (x₁ to x₂): \[ E_{a,2} = \left| \frac{2.5 - 0.5}{2.5} \right| \times 100\% = \left| \frac{2.0}{2.5} \right| \times 100\% = 80\% \] #### - After third iteration (x₂ to x₃): \[ E_{a,3} = \left| \frac{1.0 - 2.5}{1.0} \right| \times 100\% = \left| \frac{-1.5}{1.0} \right| \times 100\% = 150\% \] #### - After fourth iteration (x₃ to x₄): \[ E_{a,4} = \left| \frac{2.0 - 1.0}{2.0} \right| \times 100\% = \left| \frac{1.0}{2.0} \right| \times 100\% = 50\% \] **Summary Table (Step 2):** | iter | x | Eₐ (%) | |------|-------|----------| | 1 | 0.5 | 500 | | 2 | 2.5 | 80 | | 3 | 1.0 | 150 | | 4 | 2.0 | 50 | --- ### **Step 3: Is the Method Converging or Diverging?** **Explanation:** - The values of \( x \) are oscillating: 3 → 0.5 → 2.5 → 1.0 → 2.0. - The approximate error does not consistently decrease and is quite large, suggesting the method is **diverging** or at least not converging quickly. - According to the Fixed Point Theorem, convergence depends on \( |g'(x)| < 1 \) near the root. The graph of \( g(x) \) is steep, implying \( |g'(x)| > 1 \) in the region, which explains the observed divergence. --- ## **Final Answer** ### a) - \( x_1 \approx 0.5 \), \( x_2 \approx 2.5 \), \( x_3 \approx 1.0 \), \( x_4 \approx 2.0 \) ### b) - \( E_{a,1} = 500\% \) - \( E_{a,2} = 80\% \) - \( E_{a,3} = 150\% \) - \( E_{a,4} = 50\% \) ### c) - The method is **diverging**. The graphical results agree with the theory: since \( |g'(x)| > 1 \) near the root, the fixed-point method does not converge.

📢 Instructions:

  • Ask anything relatd to above question only.
  • For new Question goto :

Study Help, Fast Answers

VIPSolutions focuses on clear, step‑by‑step explanations so you can learn quickly. Whether you need an AI‑generated walkthrough or a short hint to get unstuck, each solution is organized for fast reading and easy review later.

Search similar questions, compare approaches, and bookmark the best answers for revision. Our goal is simple: quick, reliable study help that feels natural—not noisy.