 VIPSolutions
give answer in 2 step with explanation at the end of each step and final answer at the end:ih
Question:
give answer in 2 step with explanation at the end of each step and final answer at the end: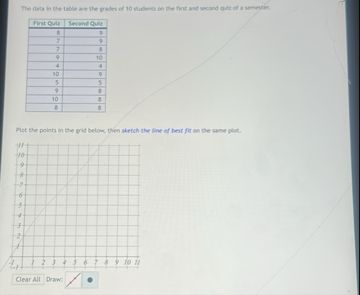 ih
This is AI generated Response.
Asked by: Rahul
Created at: 2025-12-11 03:55:29
Asked by: Rahul
Created at: 2025-12-11 03:55:29
Final Answer:
Rendered
Raw Text
Did you like this answer?
## Step 1: Plot the Points
**Explanation:**
The table gives the grades for 10 students on two quizzes. Each row is a coordinate pair: (First Quiz, Second Quiz). Plot these points on the grid.
| First Quiz | Second Quiz |
|------------|-------------|
| 7 | 9 |
| 8 | 8 |
| 5 | 6 |
| 6 | 7 |
| 9 | 10 |
| 7 | 8 |
| 8 | 7 |
| 6 | 8 |
| 5 | 3 |
| 10 | 8 |
So, plot these points:
(7,9), (8,8), (5,6), (6,7), (9,10), (7,8), (8,7), (6,8), (5,3), (10,8)
---
## Step 2: Sketch the Line of Best Fit
**Explanation:**
A line of best fit shows the general direction of the data. Most points seem to increase together (as the first quiz score increases, so does the second quiz score). Draw a line that goes through the "middle" of the points, with about as many points above as below.
- The line might start near (5,4) and rise to about (10,9), reflecting the trend.
---
## Final Answer
1. **Plot each (First Quiz, Second Quiz) pair on the grid.**
2. **Draw a line of best fit that rises from left to right, showing that higher first quiz scores tend to mean higher second quiz scores.**
This visual representation shows the relationship between the two sets of quiz scores.
📢 Instructions:
- Ask anything relatd to above question only.
- For new Question goto :