 VIPSolutions
give answer in 2 step with explanation at the end of each step and final answer at the end:Se = de HERE § Erp pri SA =
Question:
give answer in 2 step with explanation at the end of each step and final answer at the end: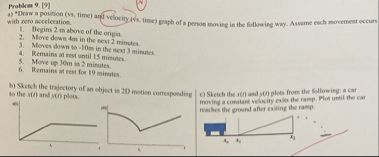 Se =
de
HERE
§ Erp
pri SA =
This is AI generated Response.
Asked by: Rahul
Created at: 2025-12-05 05:29:33
Asked by: Rahul
Created at: 2025-12-05 05:29:33
Final Answer:
Rendered
Raw Text
Did you like this answer?
Let's break down **part (a)** of the problem in **2 steps**:
Draw a position (vs. time) and velocity (vs. time) graph for the described motion.*
---
## **Step 1: Analyze and Sketch Position vs. Time**
### **Given Motions:**
1. Begins 2 m above the origin.
2. Moves down 4 m in the next 2 minutes.
3. Moves down 16 m in the next 3 minutes.
4. Remains at rest for 1 minute.
5. Moves up 10 m in 2 minutes.
6. Remains at rest for 10 minutes.
### **Position vs. Time (x-t) Graph:**
- **Start:** At \( x = 2 \) m.
- **From to 2 min:** Move down 4 m, so \( 2 - 4 = -2 \) m (linear decrease).
- **From 2 to 5 min:** Move down 16 m, \( -2 - 16 = -18 \) m (steeper linear decrease).
- **From 5 to 6 min:** Rest, so position stays at \( -18 \) m (horizontal line).
- **From 6 to 8 min:** Move up 10 m, \( -18 + 10 = -8 \) m (linear increase).
- **From 8 to 18 min:** Rest, position stays at \( -8 \) m (horizontal line).
**Explanation:**
Each segment is straight (constant velocity, zero acceleration), and horizontal where the person is at rest.
---
## **Step 2: Analyze and Sketch Velocity vs. Time**
### **Velocity for Each Segment:**
1. ** to 2 min:**
\[
\text{Velocity} = \frac{-4\,m}{2\,min} = -2\,\text{m/min}
\]
2. **2 to 5 min:**
\[
\text{Velocity} = \frac{-16\,m}{3\,min} \approx -5.33\,\text{m/min}
\]
3. **5 to 6 min:**
\[
\text{Velocity} = \,\text{m/min}
\]
4. **6 to 8 min:**
\[
\text{Velocity} = \frac{+10\,m}{2\,min} = +5\,\text{m/min}
\]
5. **8 to 18 min:**
\[
\text{Velocity} = \,\text{m/min}
\]
**Explanation:**
The velocity is constant for each segment (matching the slope of the position vs. time graph), and zero when the person is at rest.
---
## **Final Answer:**
### **Position vs. Time (x-t):**
- Starts at 2 m.
- Decreases linearly to -2 m in 2 min.
- Decreases more steeply to -18 m by 5 min.
- Stays flat at -18 m until 6 min.
- Increases linearly to -8 m by 8 min.
- Stays flat at -8 m until 18 min.
### **Velocity vs. Time (v-t):**
- \(-2\,\text{m/min}\) from –2 min.
- \(-5.33\,\text{m/min}\) from 2–5 min.
- \(\,\text{m/min}\) from 5–6 min.
- \(+5\,\text{m/min}\) from 6–8 min.
- \(\,\text{m/min}\) from 8–18 min.
Question:
All parts solved please
This is AI generated Response.
Asked by: Rahul
Created at: 2025-12-05 05:30:12
Asked by: Rahul
Created at: 2025-12-05 05:30:12
Final Answer:
Rendered
Raw Text
Did you like this answer?
# Motion Analysis of an Object
## **Step 1: Position vs. Time (x-t) Graph**
### **Given Motion Segments:**
1. **Initial Position:** Starts at \( x = 2 \) m.
2. **First Motion:** Moves down 4 m in the next 2 minutes.
3. **Second Motion:** Moves down 16 m in the next 3 minutes.
4. **Rest Phase:** Remains at rest for 1 minute.
5. **Third Motion:** Moves up 10 m in 2 minutes.
6. **Final Rest Phase:** Remains at rest for 10 minutes.
### **Position Calculation:**
- **From 0 to 2 min:** \( 2 - 4 = -2 \) m (linear decrease).
- **From 2 to 5 min:** \( -2 - 16 = -18 \) m (steeper linear decrease).
- **From 5 to 6 min:** Remains at \( -18 \) m (horizontal line).
- **From 6 to 8 min:** \( -18 + 10 = -8 \) m (linear increase).
- **From 8 to 18 min:** Remains at \( -8 \) m (horizontal line).
**Explanation:**
The position graph consists of linear segments representing the object's motion and horizontal segments during rest.
---
## **Step 2: Velocity vs. Time (v-t) Graph**
### **Velocity Calculation for Each Segment:**
1. **From 0 to 2 min:**
\[
\text{Velocity} = \frac{-4\,m}{2\,min} = -2\,\text{m/min}
\]
2. **From 2 to 5 min:**
\[
\text{Velocity} = \frac{-16\,m}{3\,min} \approx -5.33\,\text{m/min}
\]
3. **From 5 to 6 min:**
\[
\text{Velocity} = 0\,\text{m/min} \quad (\text{at rest})
\]
4. **From 6 to 8 min:**
\[
\text{Velocity} = \frac{+10\,m}{2\,min} = +5\,\text{m/min}
\]
5. **From 8 to 18 min:**
\[
\text{Velocity} = 0\,\text{m/min} \quad (\text{at rest})
\]
**Explanation:**
The velocity graph reflects constant velocities during motion periods and zero velocity during rest.
---
## **Final Answer Summary:**
### **Position vs. Time (x-t):**
- **Starts at:** \( 2 \) m
- **Decreases to:** \( -2 \) m by 2 min
- **Decreases to:** \( -18 \) m by 5 min
- **Remains at:** \( -18 \) m until 6 min
- **Increases to:** \( -8 \) m by 8 min
- **Remains at:** \( -8 \) m until 18 min
### **Velocity vs. Time (v-t):**
- **From 0 to 2 min:** \( -2\,\text{m/min} \)
- **From 2 to 5 min:** \( -5.33\,\text{m/min} \)
- **From 5 to 6 min:** \( 0\,\text{m/min} \)
- **From 6 to 8 min:** \( +5\,\text{m/min} \)
- **From 8 to 18 min:** \( 0\,\text{m/min} \)
This completes the analysis of the motion.
📢 Instructions:
- Ask anything relatd to above question only.
- For new Question goto :