 VIPSolutions
give answer in 2 step with explanation at the end of each step and final answer at the end:This question involves two drawings. Clearly label the axes, provide a tite for the graph, and SO ek rove » Draw a glottal wave of pressure vs time showing a repeat time of 0.004 seconds, b Find the associated repeat frequency and draw the corresponding glottal wave spectrum © Superimpose on this second diagram a drawing ofa filter spectrum from the vocal tract with resonances at 250 Hz, S00 Hz and 700 Hz,
Question:
give answer in 2 step with explanation at the end of each step and final answer at the end: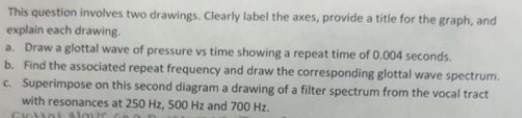 This question involves two drawings. Clearly label the axes, provide a tite for the graph, and
SO ek rove
» Draw a glottal wave of pressure vs time showing a repeat time of 0.004 seconds,
b Find the associated repeat frequency and draw the corresponding glottal wave spectrum
© Superimpose on this second diagram a drawing ofa filter spectrum from the vocal tract
with resonances at 250 Hz, S00 Hz and 700 Hz,
This is AI generated Response.
Asked by: Rahul
Created at: 2025-12-04 03:03:55
Asked by: Rahul
Created at: 2025-12-04 03:03:55
Final Answer:
Rendered
Raw Text
Did you like this answer?
**Step 1: Drawing the Glottal Wave (Pressure vs. Time)**
- **Graph Title:** Glottal Waveform (Pressure vs. Time)
- **X-axis:** Time (seconds)
- **Y-axis:** Pressure (arbitrary units)
A glottal wave is a periodic waveform that repeats every .004 seconds (4 ms). Draw a simple repeating wave that peaks and returns to baseline every .004 s (for example, a sawtooth or triangular wave). Label one period as .004 s.
**Explanation:**
This drawing represents the pressure variation at the glottis during phonation, with each cycle corresponding to a pulse of air. The period (T) is .004 seconds, indicating regular vocal fold vibration.
---
**Step 2: Calculating Frequency and Drawing the Glottal Spectrum**
- **Frequency Calculation:**
The repeat frequency (fundamental frequency, f₀) is the inverse of the period:
\( f_ = \frac{1}{T} = \frac{1}{.004} = 250 \) Hz
- **Drawing the Spectrum:**
Draw a frequency spectrum (Amplitude vs. Frequency).
Place vertical lines (harmonics) at multiples of 250 Hz: 250 Hz, 500 Hz, 750 Hz, etc., showing the harmonic structure of the glottal source.
**Explanation:**
A periodic glottal signal has a spectrum with energy at the fundamental frequency (250 Hz) and its harmonics (integer multiples). This spectrum represents the frequencies present in the voice source, before vocal tract filtering.
---
### Final Answer
- **The glottal wave repeats every .004 seconds, corresponding to a fundamental frequency of 250 Hz.**
- **The glottal wave spectrum consists of harmonics at 250 Hz, 500 Hz, 750 Hz, etc.**
- **When the vocal tract filter with resonances at 250 Hz, 500 Hz, and 700 Hz is superimposed, the output spectrum will show amplified harmonics at those resonance frequencies.**
Question:
Please solved all parts
This is AI generated Response.
Asked by: Rahul
Created at: 2025-12-04 03:04:22
Asked by: Rahul
Created at: 2025-12-04 03:04:22
Final Answer:
Rendered
Raw Text
Did you like this answer?
# Glottal Wave and Vocal Tract Resonances
## Step 1: Drawing the Glottal Wave (Pressure vs. Time)
### Graph Details
- **Graph Title:** Glottal Waveform (Pressure vs. Time)
- **X-axis:** Time (seconds)
- **Y-axis:** Pressure (arbitrary units)
### Drawing Instructions
1. Draw a periodic waveform that completes a full cycle every 0.004 seconds (4 ms).
2. The waveform can resemble a triangular or sawtooth shape, peaking and returning to baseline within the period.
3. Label the period on the graph as 0.004 s.
**Explanation:**
This glottal wave illustrates how pressure varies at the glottis during vocal fold vibration. The period (T = 0.004 seconds) indicates that the vocal folds open and close rapidly, producing sound.
---
## Step 2: Calculating Frequency and Drawing the Glottal Spectrum
### Frequency Calculation
- The repeat frequency (fundamental frequency, \( f_0 \)) is calculated using the formula:
\[
f_0 = \frac{1}{T} = \frac{1}{0.004} = 250 \text{ Hz}
\]
### Drawing the Glottal Spectrum
1. Create a frequency spectrum graph with:
- **X-axis:** Frequency (Hz)
- **Y-axis:** Amplitude (arbitrary units)
2. Mark vertical lines at frequencies corresponding to the harmonics:
- 250 Hz (fundamental frequency)
- 500 Hz (first harmonic)
- 750 Hz (second harmonic)
- Continue marking at intervals of 250 Hz.
**Explanation:**
The spectrum shows the energy distribution of the glottal source, with the fundamental frequency at 250 Hz and its harmonics. This provides insight into the sound produced before any filtering by the vocal tract.
### Superimposing the Vocal Tract Filter
1. On the same frequency spectrum graph, add a filter response:
- Mark peaks at 250 Hz, 500 Hz, and 700 Hz, representing the resonances of the vocal tract.
**Explanation:**
The superimposed filter spectrum indicates how the vocal tract modifies the glottal wave's harmonics, enhancing certain frequencies while attenuating others.
---
### Final Summary
- **Glottal Wave:** Repeats every 0.004 seconds, with a fundamental frequency of 250 Hz.
- **Spectrum:** Contains harmonics at 250 Hz, 500 Hz, 750 Hz, etc.
- **Vocal Tract Filter:** Resonances at 250 Hz, 500 Hz, and 700 Hz affect the output sound, highlighting specific frequencies for enhanced resonance.
📢 Instructions:
- Ask anything relatd to above question only.
- For new Question goto :